Fig. 2
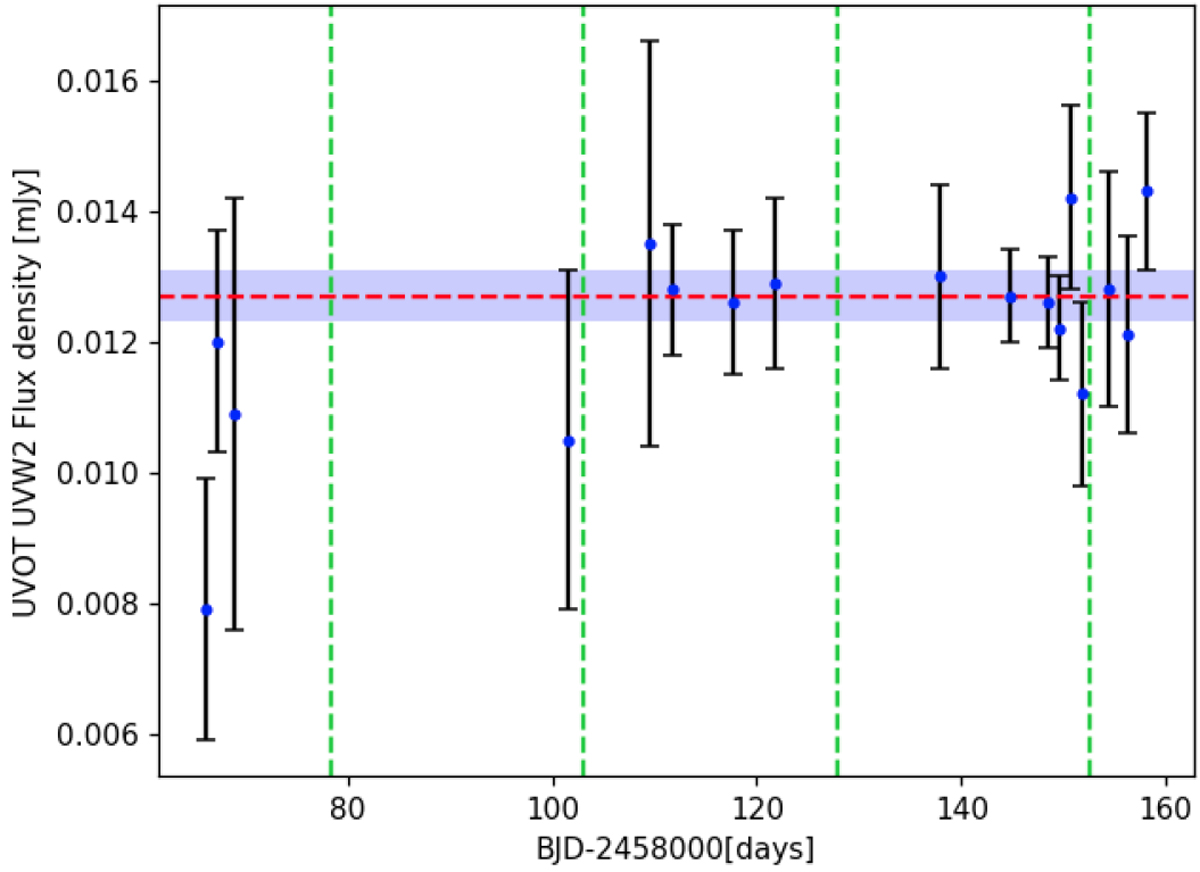
LHS 1140 UVOT-UVW2 flux-density light curve. Error bars represent the 1σ uncertainty. The vertical green dashed lines are the epochs of transit of LHS 1140b. The horizontal dashed red line is the average flux density (12.7 μ Jy) as obtained from the analysis of the stacked UV image (Fig. 1) with its 1σ uncertainty (0.4 μ Jy, shaded region).
Current usage metrics show cumulative count of Article Views (full-text article views including HTML views, PDF and ePub downloads, according to the available data) and Abstracts Views on Vision4Press platform.
Data correspond to usage on the plateform after 2015. The current usage metrics is available 48-96 hours after online publication and is updated daily on week days.
Initial download of the metrics may take a while.