Free Access
Fig. 4.
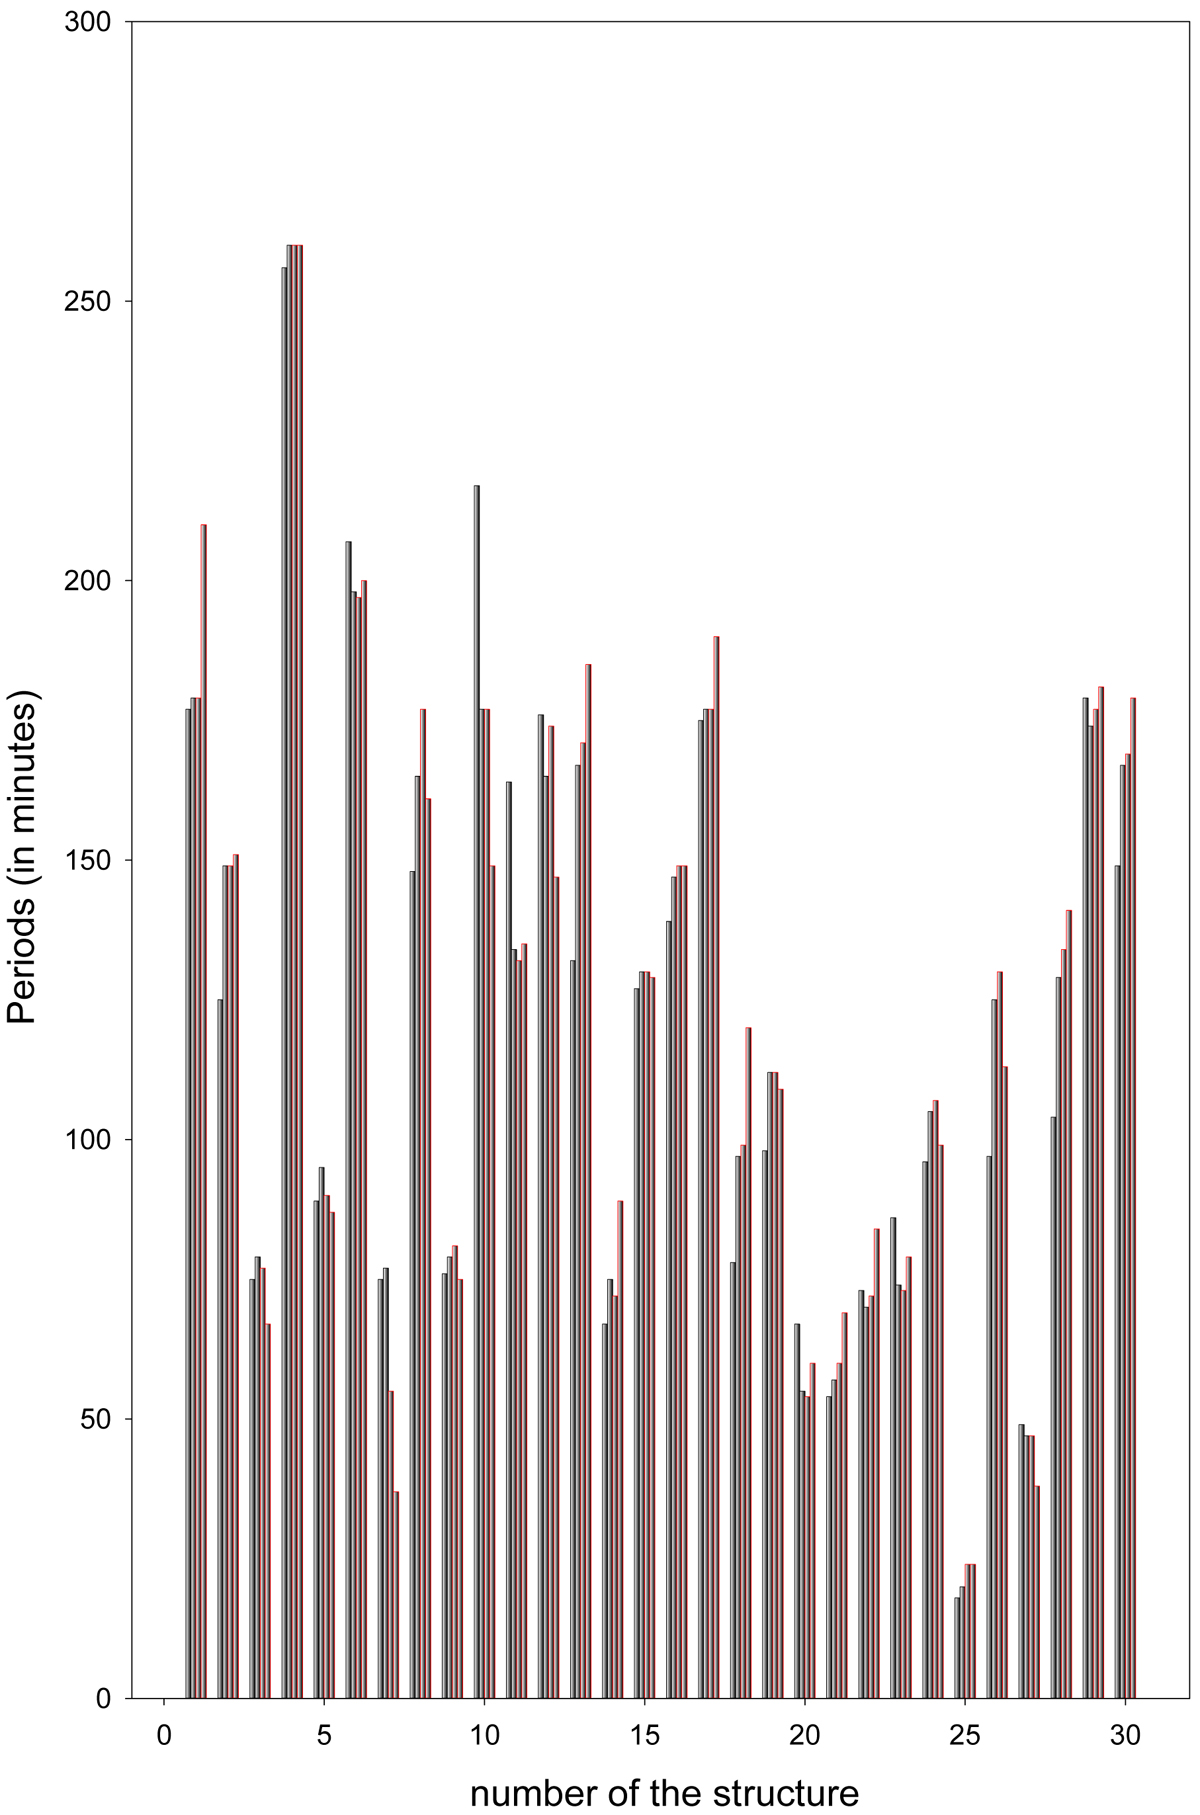
Histogram of the periods of oscillations obtained for the thirty SSM structures. Bars obtained for the periods in the magnetic fields and in 1600 Å band are marked in black; bars obtained for the periods in 1700 Å and in 304 Å bands are marked in red.
Current usage metrics show cumulative count of Article Views (full-text article views including HTML views, PDF and ePub downloads, according to the available data) and Abstracts Views on Vision4Press platform.
Data correspond to usage on the plateform after 2015. The current usage metrics is available 48-96 hours after online publication and is updated daily on week days.
Initial download of the metrics may take a while.