Fig. 2.
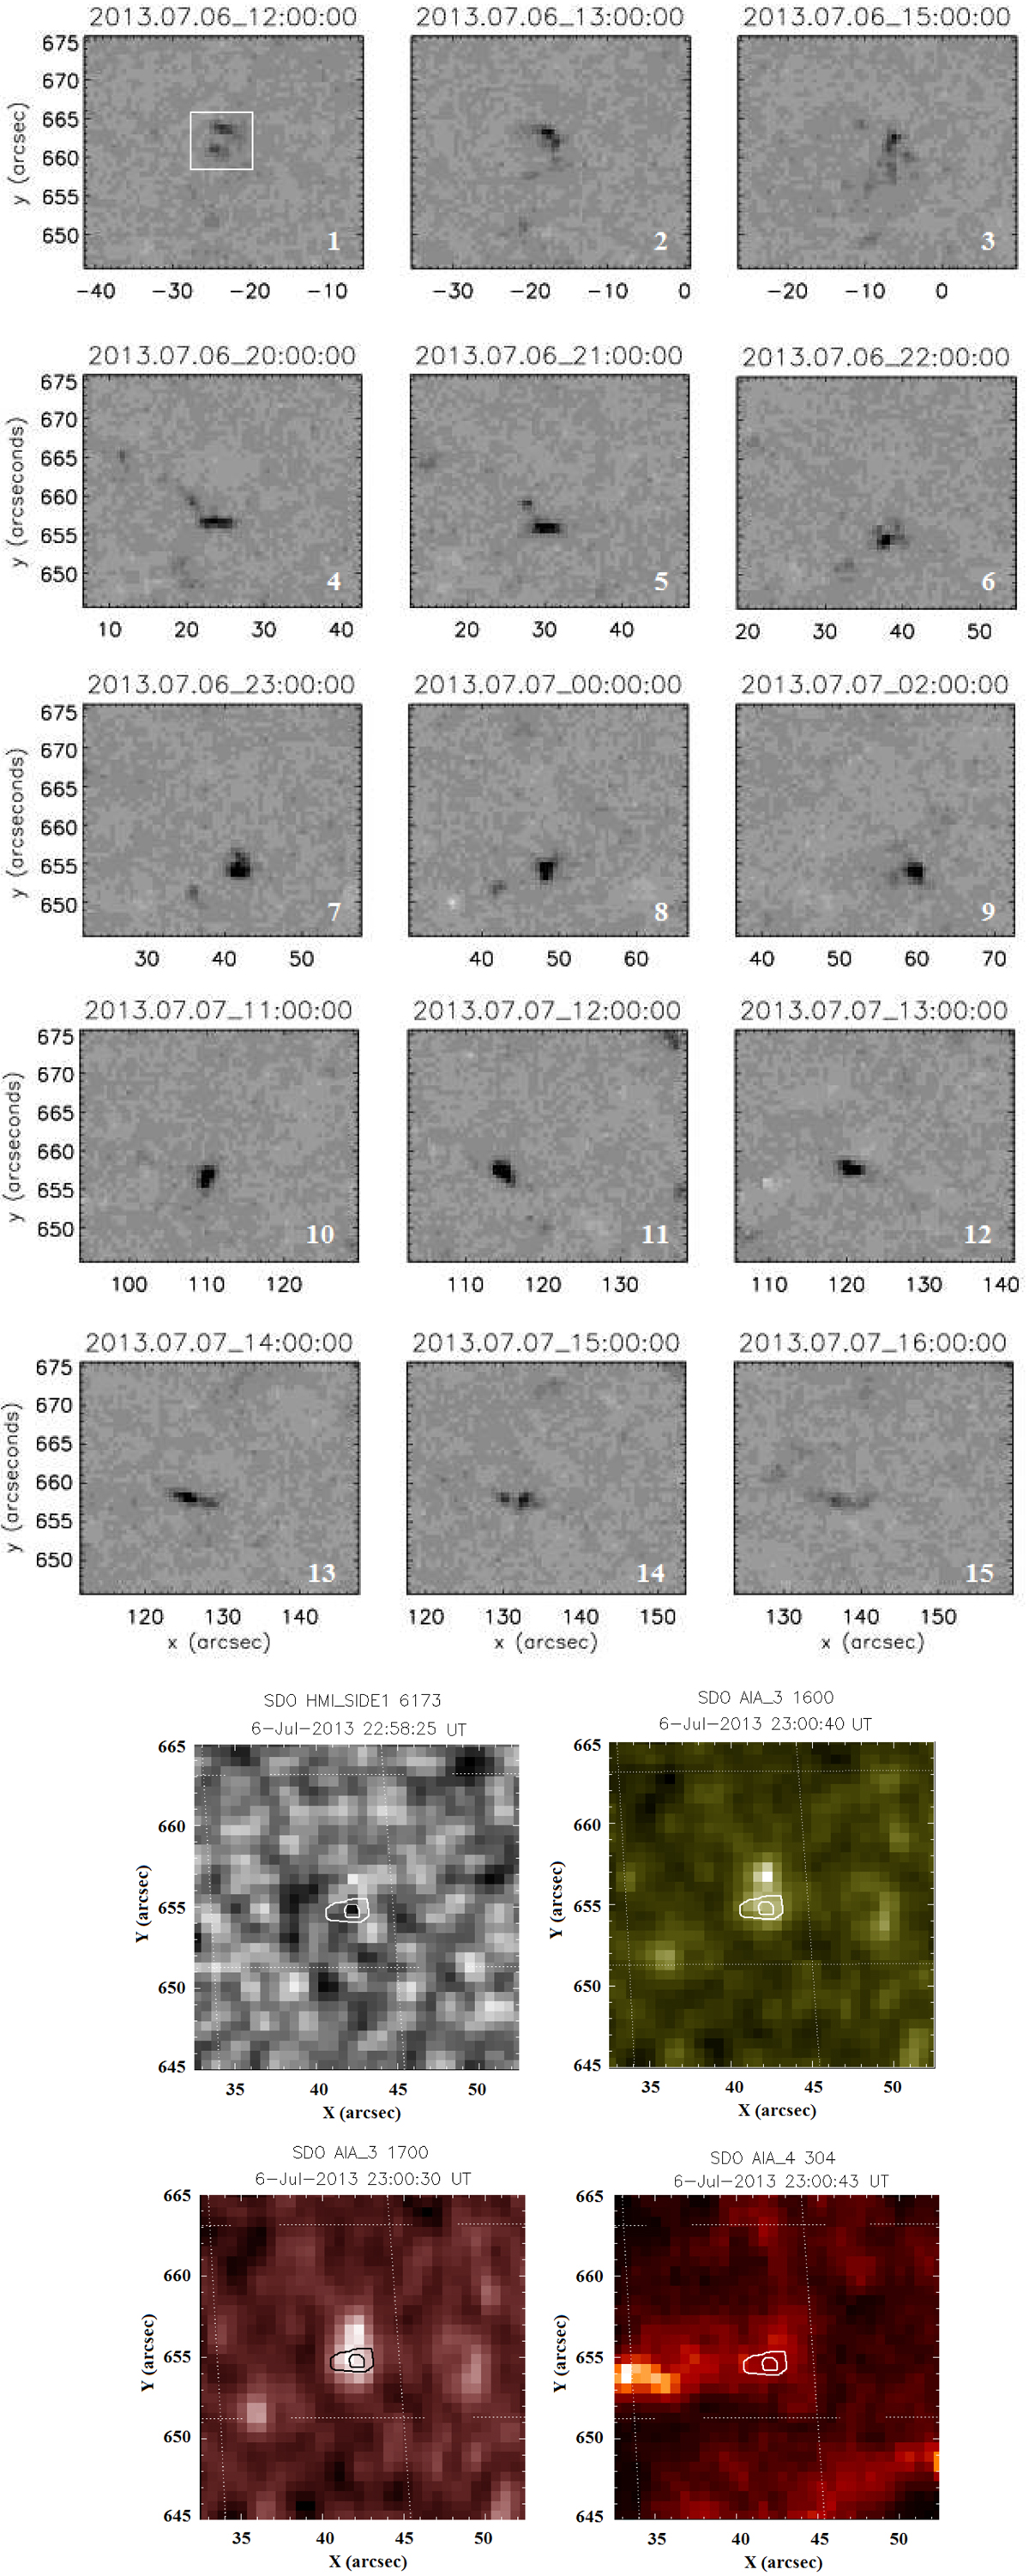
Top: sample of typical structural evolution of magnetic “source 4” from Table 1 during the observations. Process of formation, the structurally stable phase, and the phase of destruction contain some consistent sets of images of the magnetic structure. The sequence number of the image is read from the left to the right and from the top to the bottom. Bottom: images obtained in different spectral bands with the contours of 50% and 90% of the magnetic field strength for “source 4”.
Current usage metrics show cumulative count of Article Views (full-text article views including HTML views, PDF and ePub downloads, according to the available data) and Abstracts Views on Vision4Press platform.
Data correspond to usage on the plateform after 2015. The current usage metrics is available 48-96 hours after online publication and is updated daily on week days.
Initial download of the metrics may take a while.