Fig. 9
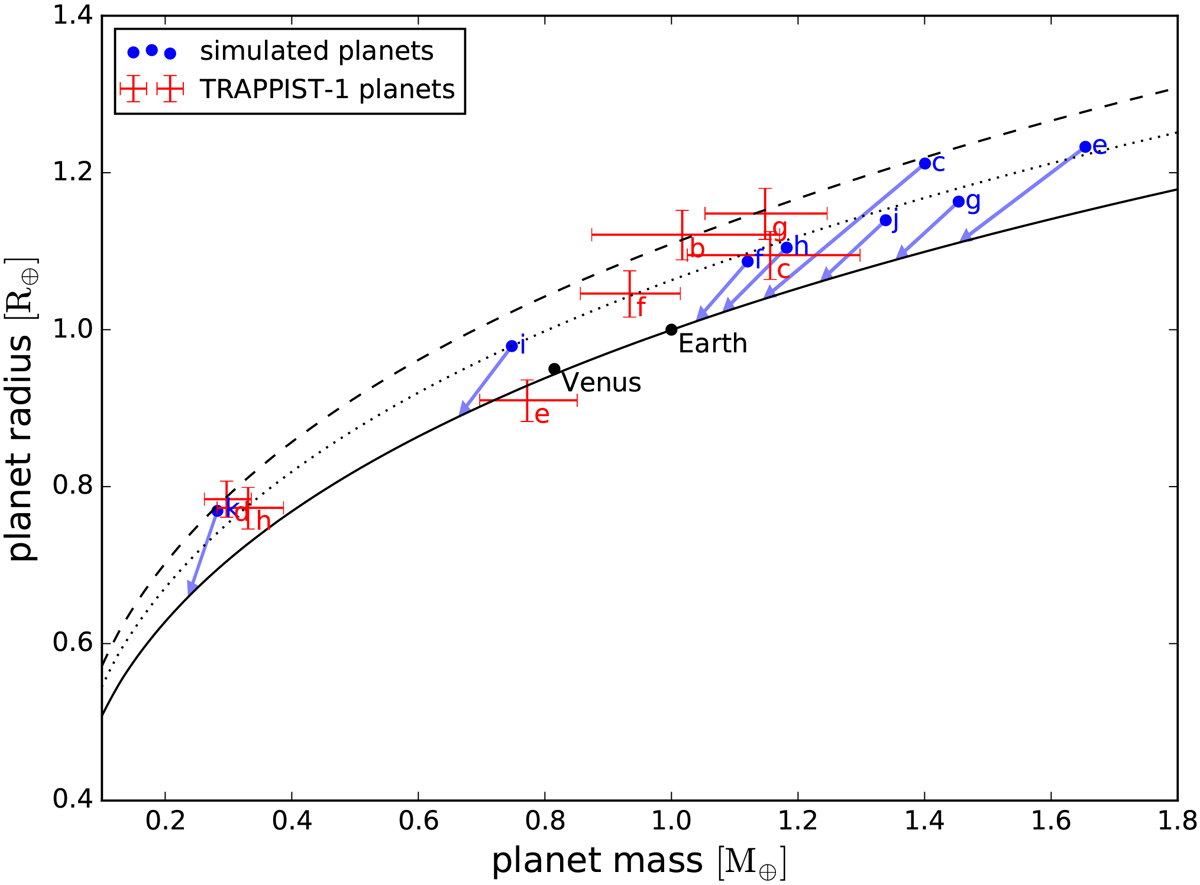
Mass-radius diagram of simulated planets (blue dots) and TRAPPIST-1 planets (red crosses), data taken from Dorn et al. (2018). The solid, dotted, and dashed lines correspond to mass-radius relations for a rocky composition and a waterfraction of 0, 10, and 20%, respectively. The mass-radius relations are the same as the ones used in Dorn et al. (2018). The arrows starting from the simulated planets depict the trajectories on the mass-radius diagram that the simulated planets would cover if they were to lose their entire water content.
Current usage metrics show cumulative count of Article Views (full-text article views including HTML views, PDF and ePub downloads, according to the available data) and Abstracts Views on Vision4Press platform.
Data correspond to usage on the plateform after 2015. The current usage metrics is available 48-96 hours after online publication and is updated daily on week days.
Initial download of the metrics may take a while.