Fig. 5
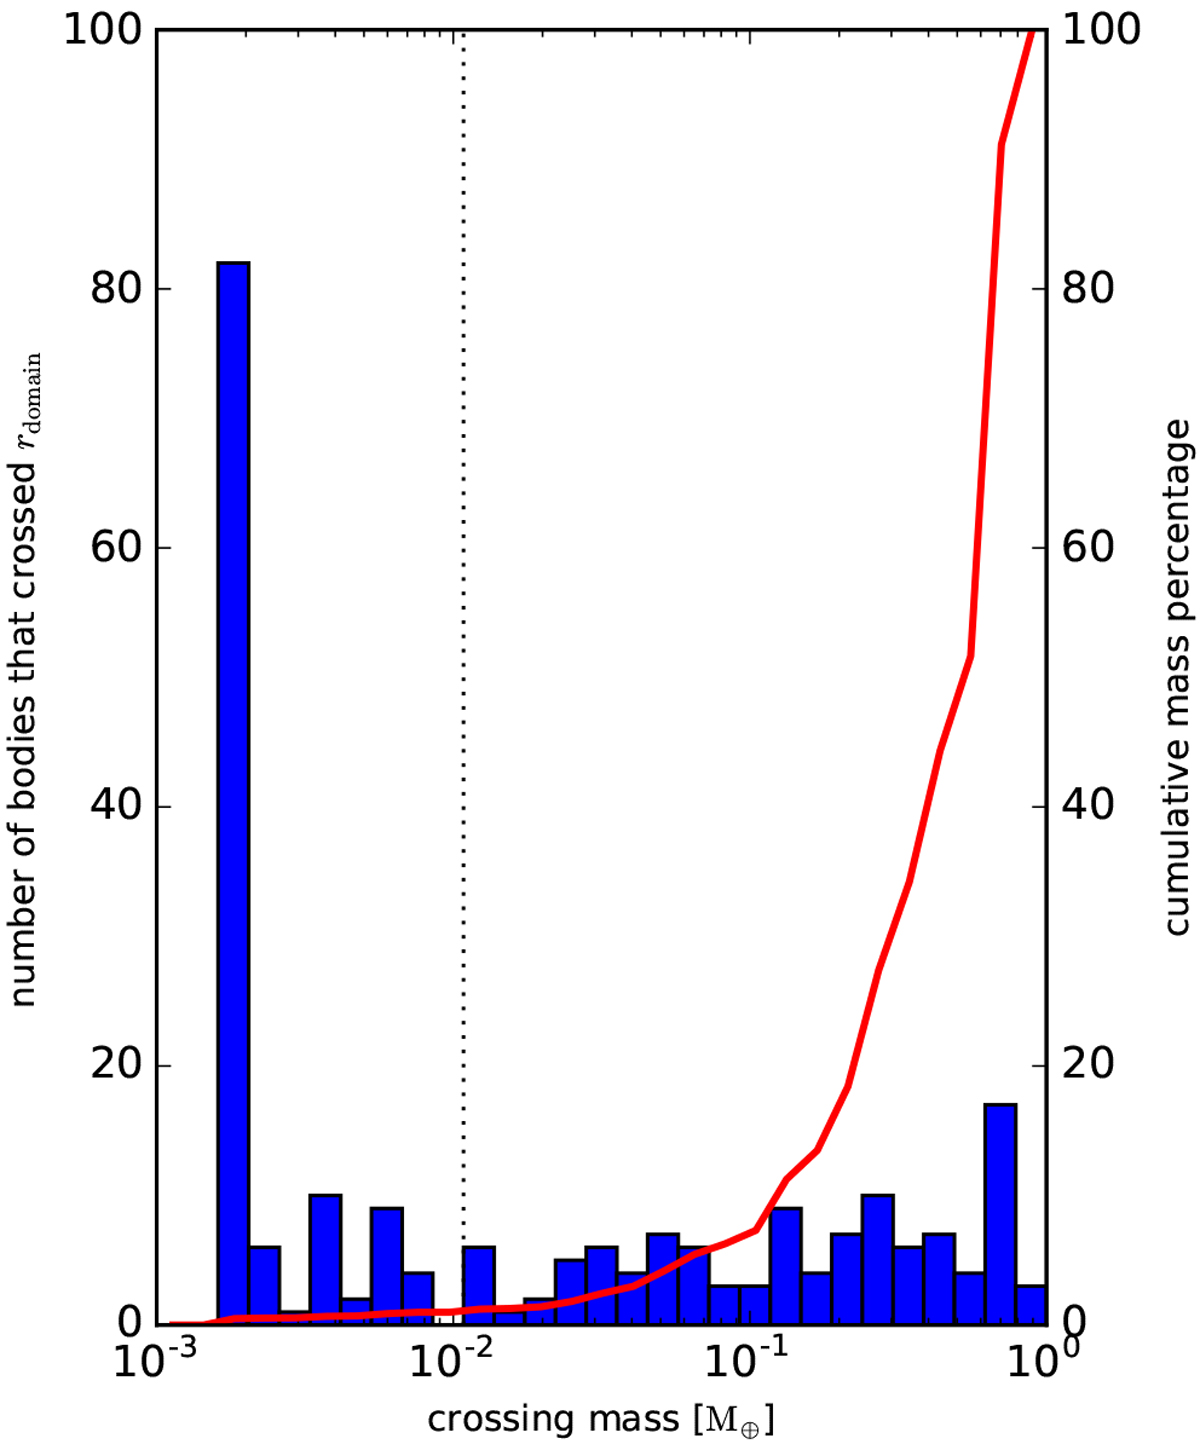
Histogram of the masses of bodies that crossed the inner domain radius of the N-body simulation rdomain. The peakat the smallest mass bin is due to bodies of the initial planetesimal size. The red line denotes the cumulative mass percentage of crossed bodies. The vertical dotted line corresponds to a cumulative mass percentage of 1%. Bodies to the left of this threshold are neglected after they crossed rdomain; only the bodies more massive than the threshold mass are followed. This plot stacks the results of ten realisations of the fiducial simulation.
Current usage metrics show cumulative count of Article Views (full-text article views including HTML views, PDF and ePub downloads, according to the available data) and Abstracts Views on Vision4Press platform.
Data correspond to usage on the plateform after 2015. The current usage metrics is available 48-96 hours after online publication and is updated daily on week days.
Initial download of the metrics may take a while.