Fig. 6.
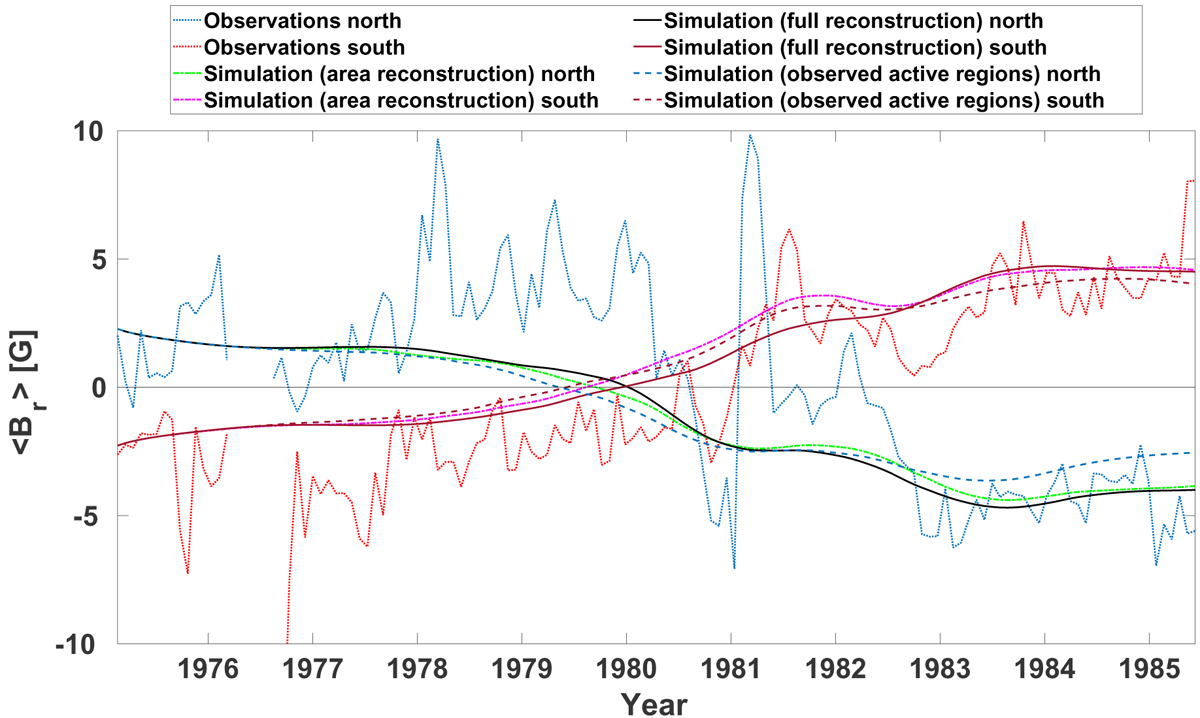
Average magnetic field below −60° and above 60° latitude from the simulations and observations shown in Fig. 5. Dotted lines are observations, solid lines are from a simulation using the full reconstruction, dash-dotted lines are from a simulation using the area reconstruction, and dashed lines are from a simulation using the observed active regions. Blue, green, and black lines are for the northern hemisphere, while red and purple lines are for the southern hemisphere.
Current usage metrics show cumulative count of Article Views (full-text article views including HTML views, PDF and ePub downloads, according to the available data) and Abstracts Views on Vision4Press platform.
Data correspond to usage on the plateform after 2015. The current usage metrics is available 48-96 hours after online publication and is updated daily on week days.
Initial download of the metrics may take a while.