Free Access
Fig. 5.
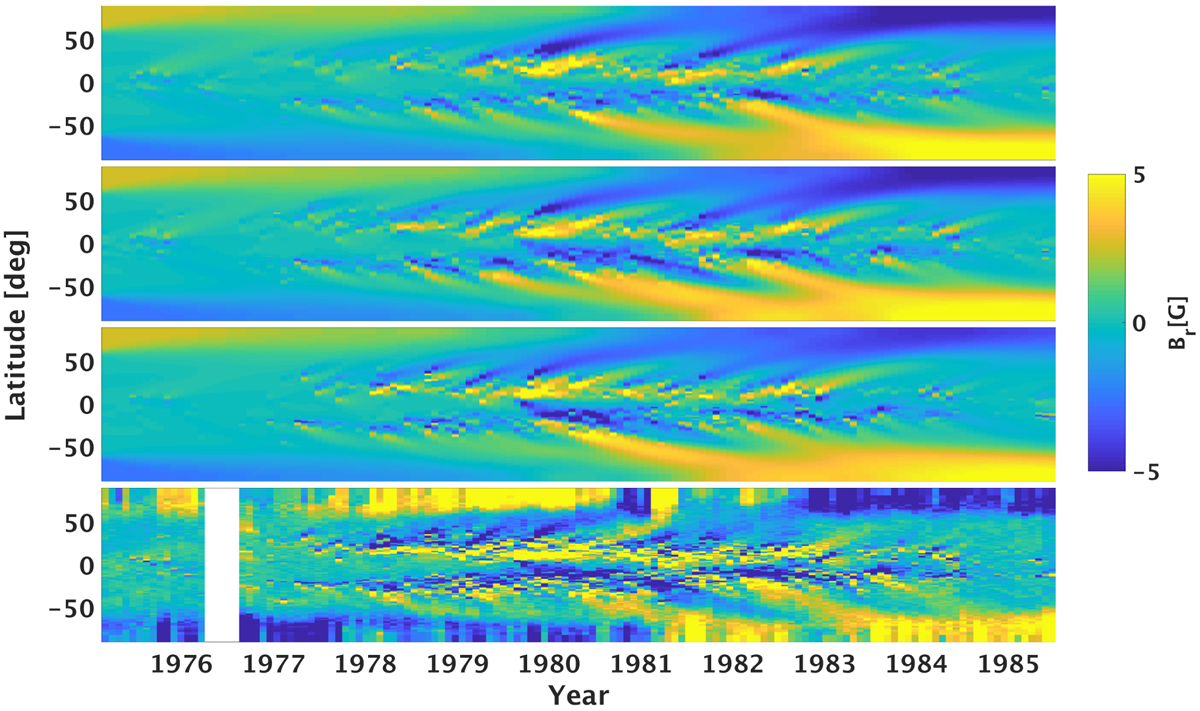
Supersynoptic maps of the photospheric magnetic field from 1975 to 1985 from simulations using the full reconstruction (top panel), the area reconstruction (second panel from the top), and the observed active regions (third panel from the top) as input. Bottom panel: NSO/KP magnetic field observations.
Current usage metrics show cumulative count of Article Views (full-text article views including HTML views, PDF and ePub downloads, according to the available data) and Abstracts Views on Vision4Press platform.
Data correspond to usage on the plateform after 2015. The current usage metrics is available 48-96 hours after online publication and is updated daily on week days.
Initial download of the metrics may take a while.