Fig. 3.
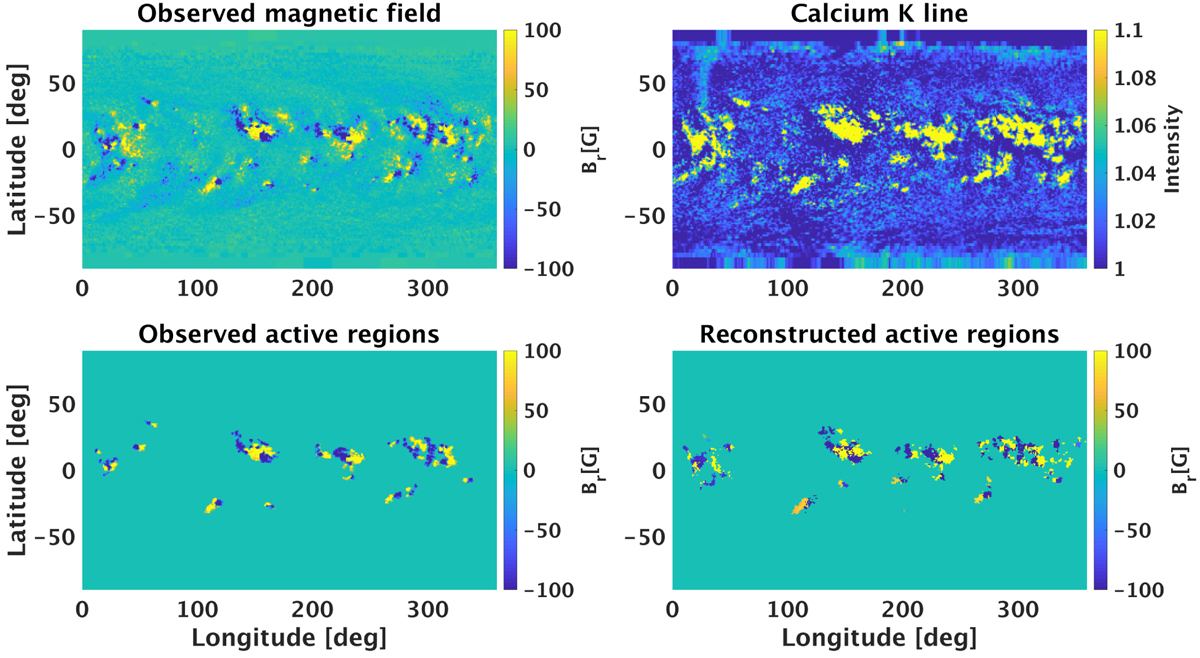
Synoptic map of the photospheric magnetic field of Carrington Rotation 1708 (May 1981) observed at NSO/KP (top left), synoptic map of the calcium K line intensity of the same rotation (top right), active regions identified from the synoptic map of the magnetic field (bottom left), and active regions reconstructed from the calcium K line and sunspot observations (bottom right).
Current usage metrics show cumulative count of Article Views (full-text article views including HTML views, PDF and ePub downloads, according to the available data) and Abstracts Views on Vision4Press platform.
Data correspond to usage on the plateform after 2015. The current usage metrics is available 48-96 hours after online publication and is updated daily on week days.
Initial download of the metrics may take a while.