Free Access
Fig. 2.
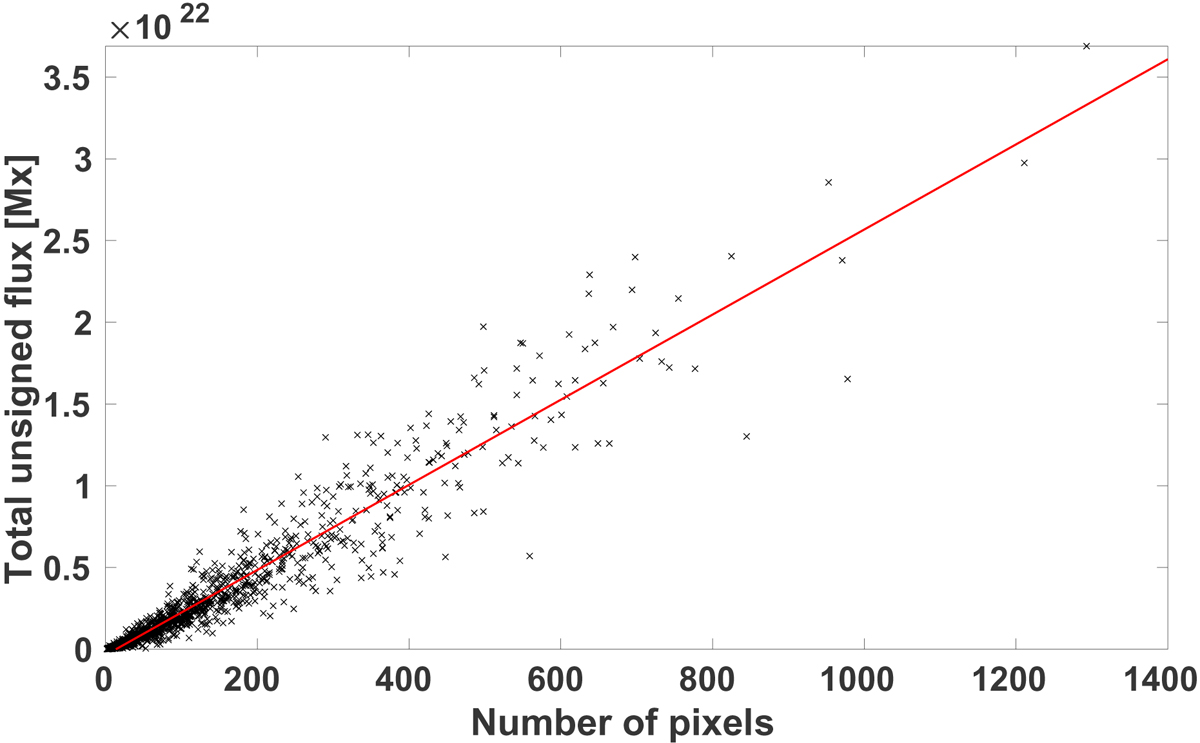
Total unsigned flux inside a plage (in Maxwells) as a function of plage area (in number of pixels). The solid red line gives the linear fit. Data from all Carrington rotations for 1974−1985 were used.
Current usage metrics show cumulative count of Article Views (full-text article views including HTML views, PDF and ePub downloads, according to the available data) and Abstracts Views on Vision4Press platform.
Data correspond to usage on the plateform after 2015. The current usage metrics is available 48-96 hours after online publication and is updated daily on week days.
Initial download of the metrics may take a while.