Fig. 11.
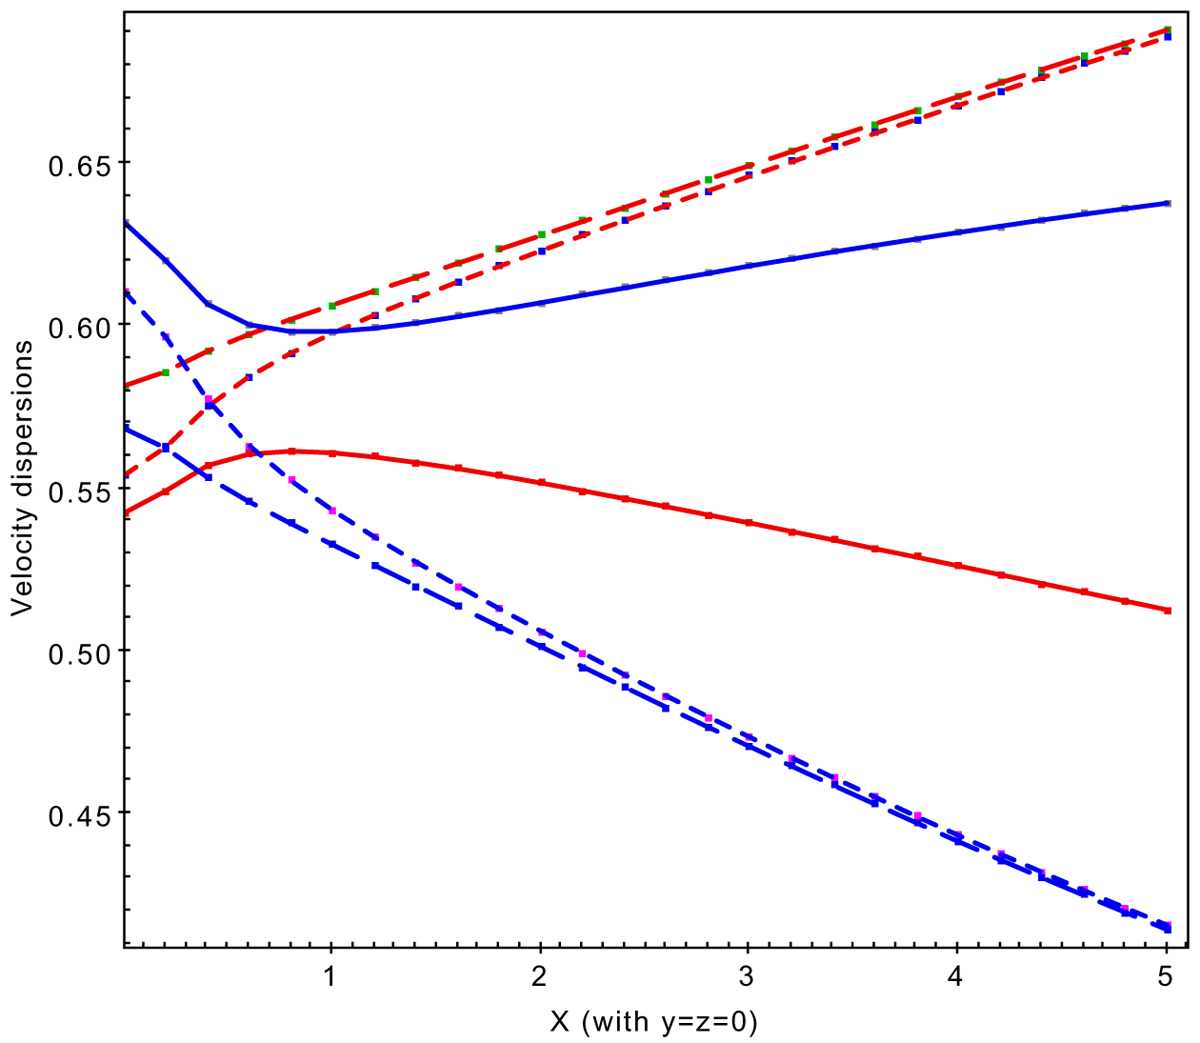
Velocity dispersions versus x-distance (y = z = 0) to centre for models given by Eq. (29). The blue lines model (b, c)=(+0.3, +0.3) is dominated by radial obits. The red lines models (b, c)=(−0.2, −0.2) are dominated by tangential obits. Continuous lines indicate radial dispersions σR, while short- and long-dashed lines indicate tangential dispersions σϕ and σθ, respectively.
Current usage metrics show cumulative count of Article Views (full-text article views including HTML views, PDF and ePub downloads, according to the available data) and Abstracts Views on Vision4Press platform.
Data correspond to usage on the plateform after 2015. The current usage metrics is available 48-96 hours after online publication and is updated daily on week days.
Initial download of the metrics may take a while.