Fig. 7.
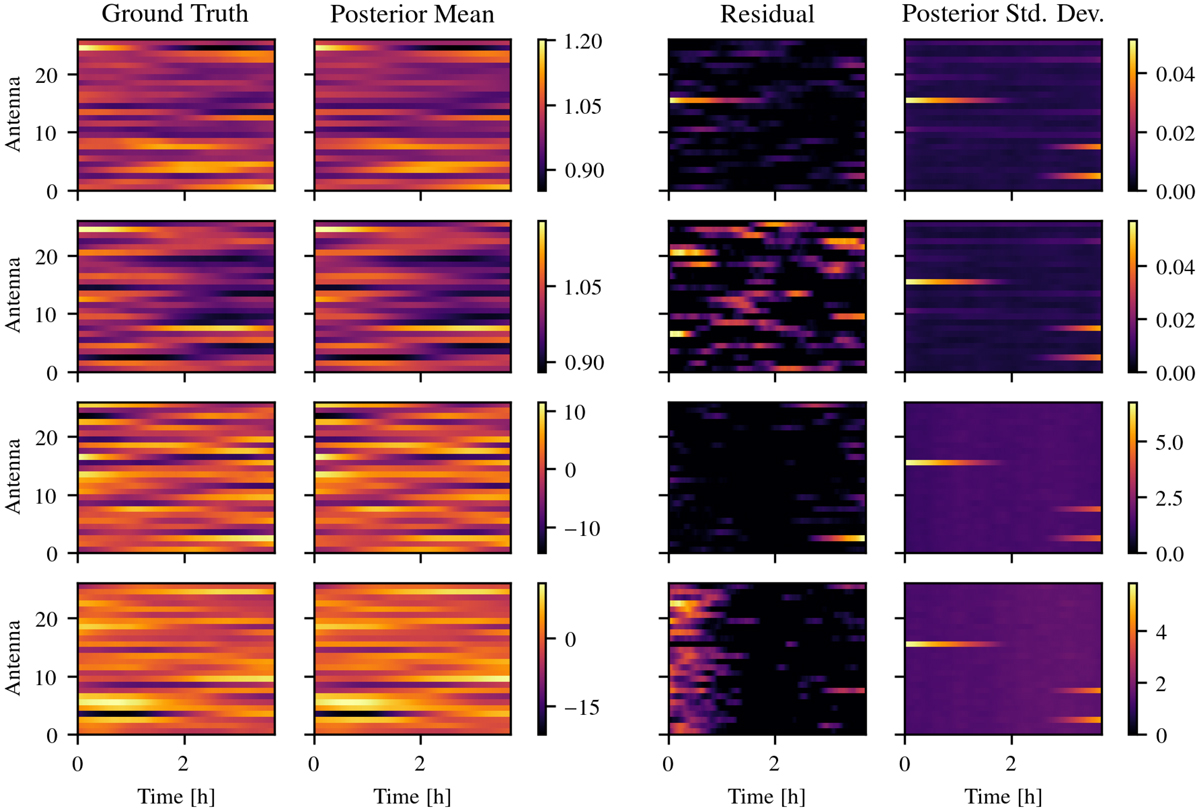
Synthetic observation: calibration solutions. First two rows: amplitude and bottom two rows: phase calibration solutions. First and third row: LL-polarization and second and last row: RR-polarization. Third column: absolute value of the difference between posterior mean and ground truth. Fourth column: point-wise posterior standard deviation as provided by RESOLVE. Amplitudes do not have a unit as they are a simple factor applied to the data. Phases are shown in degrees.
Current usage metrics show cumulative count of Article Views (full-text article views including HTML views, PDF and ePub downloads, according to the available data) and Abstracts Views on Vision4Press platform.
Data correspond to usage on the plateform after 2015. The current usage metrics is available 48-96 hours after online publication and is updated daily on week days.
Initial download of the metrics may take a while.