Open Access
Fig. 11.
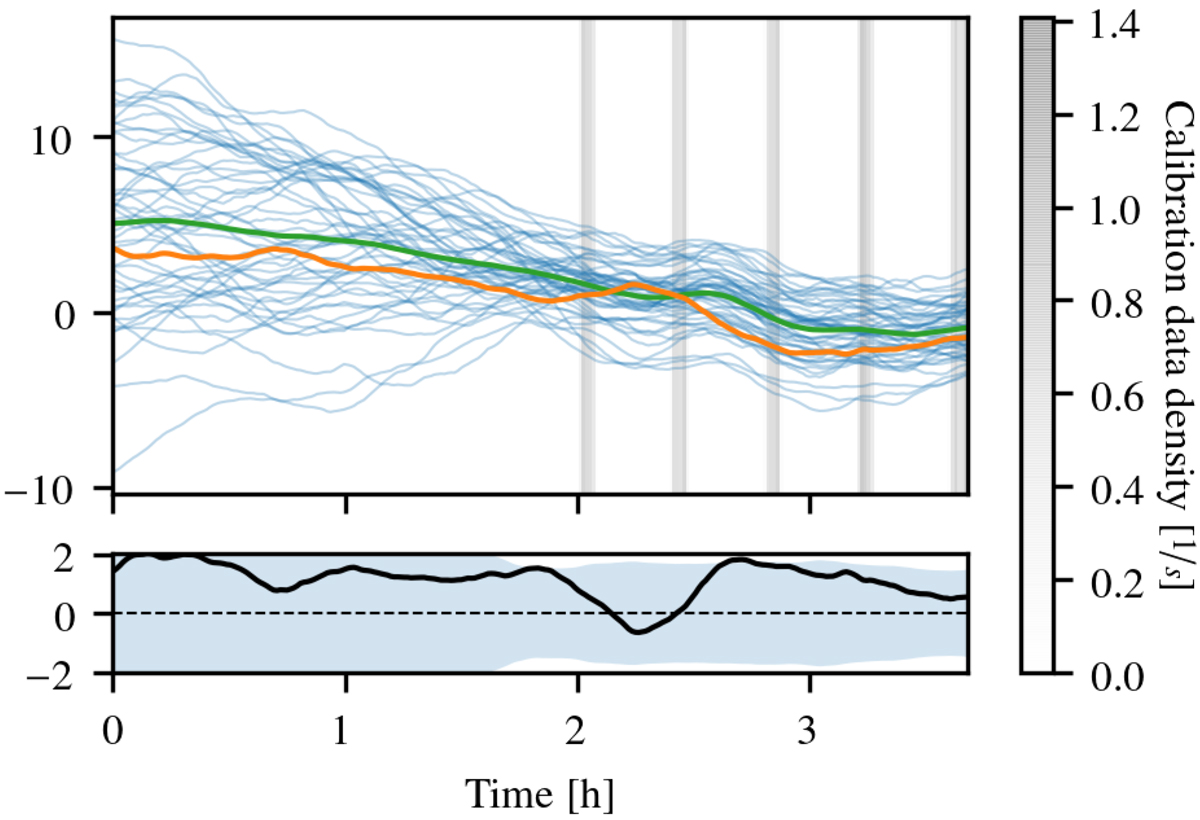
Synthetic observation: phase solutions for antenna 15 and polarization R. Colors as in Fig. 12 and all phases are plotted in degrees. On the left-hand side all data points have been flagged.
Current usage metrics show cumulative count of Article Views (full-text article views including HTML views, PDF and ePub downloads, according to the available data) and Abstracts Views on Vision4Press platform.
Data correspond to usage on the plateform after 2015. The current usage metrics is available 48-96 hours after online publication and is updated daily on week days.
Initial download of the metrics may take a while.