Free Access
Fig. A.7
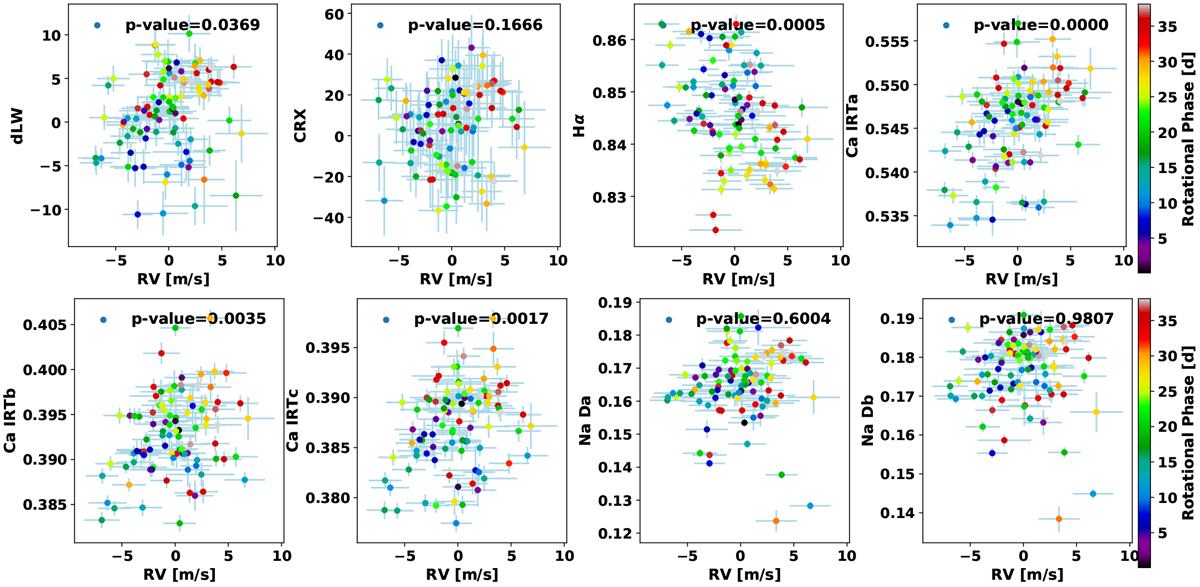
Top panels: correlation plots between the activity indices and radial velocities of GJ 686. Color code represents the phase with the estimated rotation period of 38.4 d. The p-value of a linear fit is shown.
Current usage metrics show cumulative count of Article Views (full-text article views including HTML views, PDF and ePub downloads, according to the available data) and Abstracts Views on Vision4Press platform.
Data correspond to usage on the plateform after 2015. The current usage metrics is available 48-96 hours after online publication and is updated daily on week days.
Initial download of the metrics may take a while.