Fig. A.3
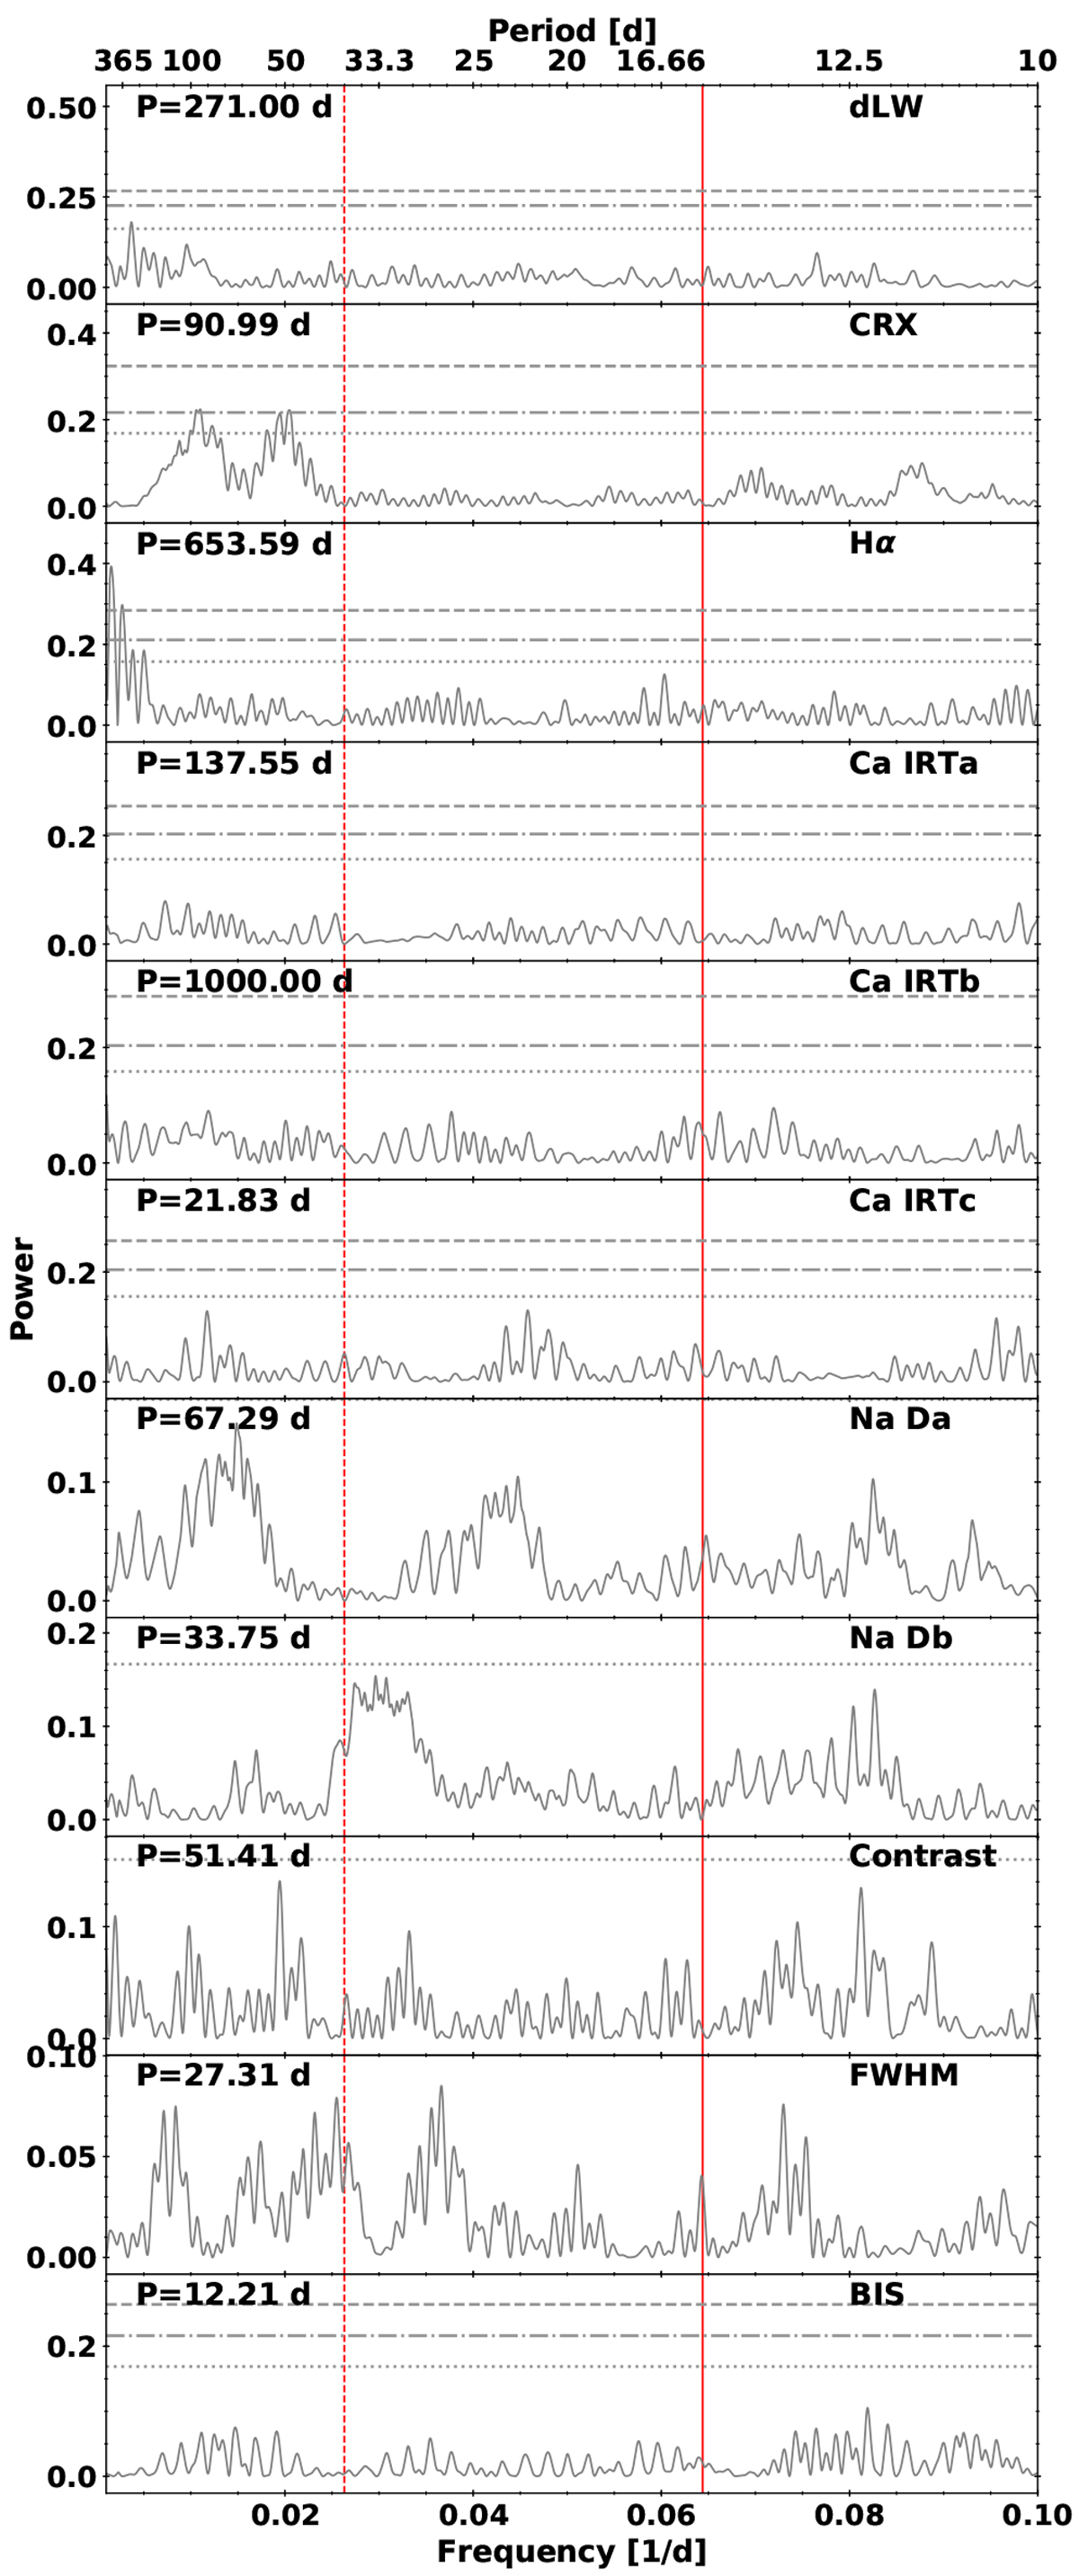
Periodograms of the residuals after subtracting the highest signal of the activity indicators of GJ 686. The vertical solid line indicates the period of the suggested planet, while the vertical red dotted line denotes the period attributed to the rotation period. The periods reported in each panel refer to the highest peak. The horizontal lines represent the bootstrapped 10, 1, and 0.1% FAP levels.
Current usage metrics show cumulative count of Article Views (full-text article views including HTML views, PDF and ePub downloads, according to the available data) and Abstracts Views on Vision4Press platform.
Data correspond to usage on the plateform after 2015. The current usage metrics is available 48-96 hours after online publication and is updated daily on week days.
Initial download of the metrics may take a while.