Fig. 14
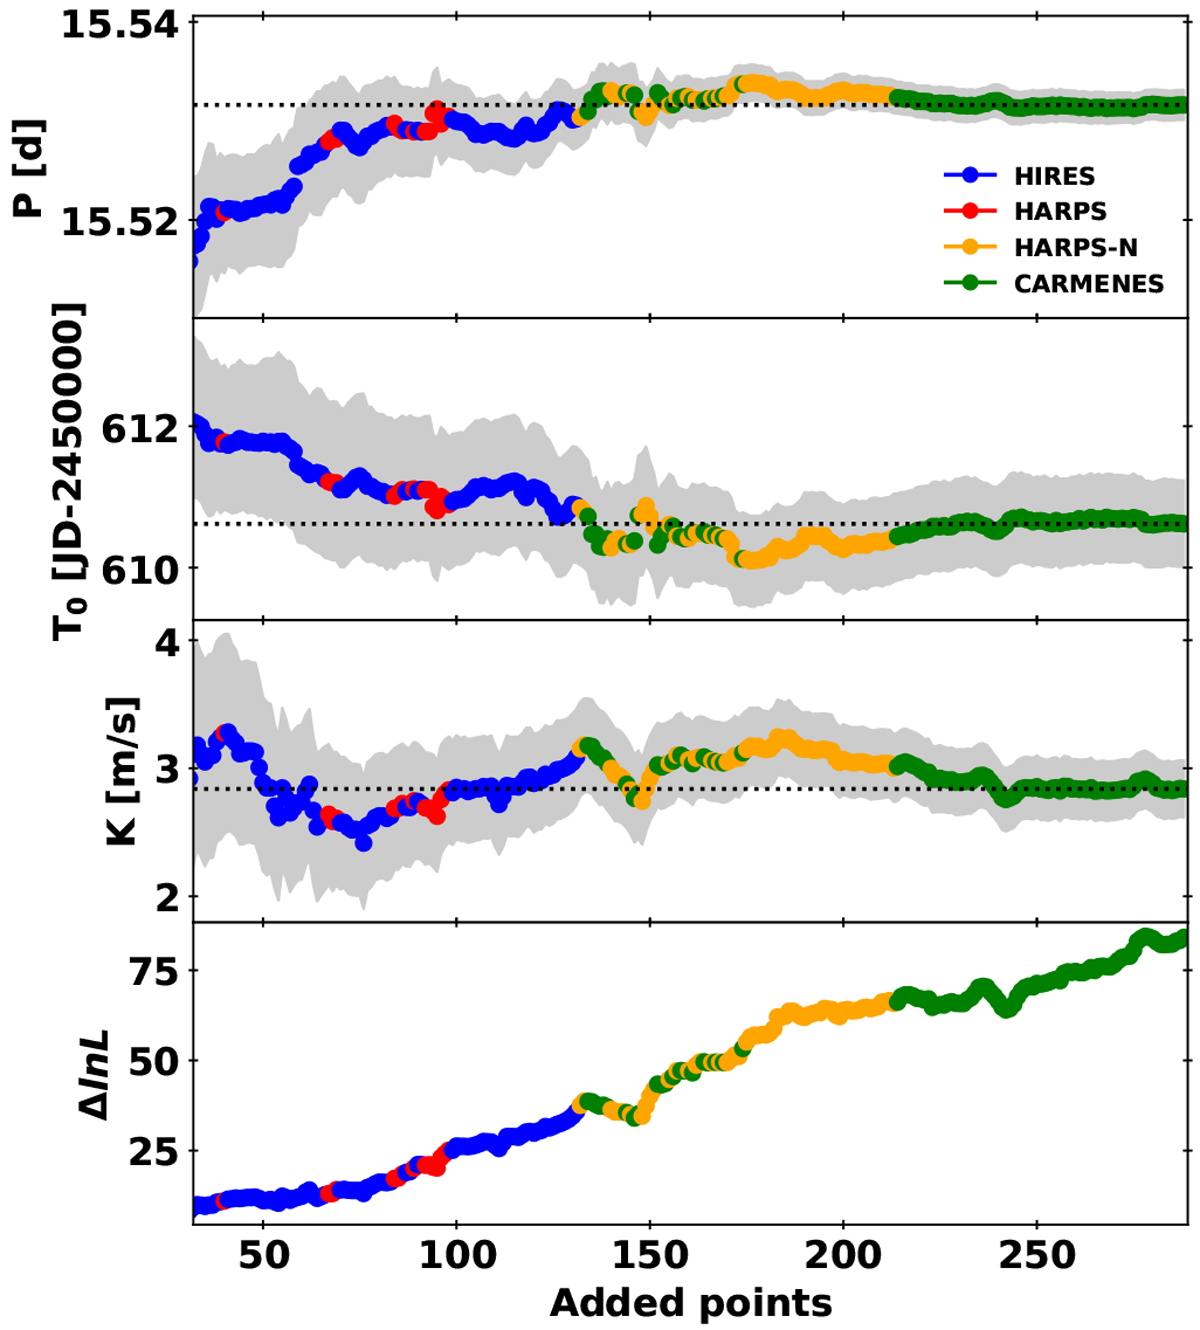
Orbital parameters of a circular orbit and increment in the log likelihood as a function of the number of RV points, which are added chronologically. Each color represents a different instrument, and the gray shaded regions indicate the uncertainties computed from the MCMC posterior distribution. First three panels: period, time of maximum RV, and semi-amplitude, respectively. Bottom panel: increment in log likelihood with respect to a fit to the mean value. The black dotted line indicates the orbital parameters obtained from the combined RVs.
Current usage metrics show cumulative count of Article Views (full-text article views including HTML views, PDF and ePub downloads, according to the available data) and Abstracts Views on Vision4Press platform.
Data correspond to usage on the plateform after 2015. The current usage metrics is available 48-96 hours after online publication and is updated daily on week days.
Initial download of the metrics may take a while.