Fig. 7.
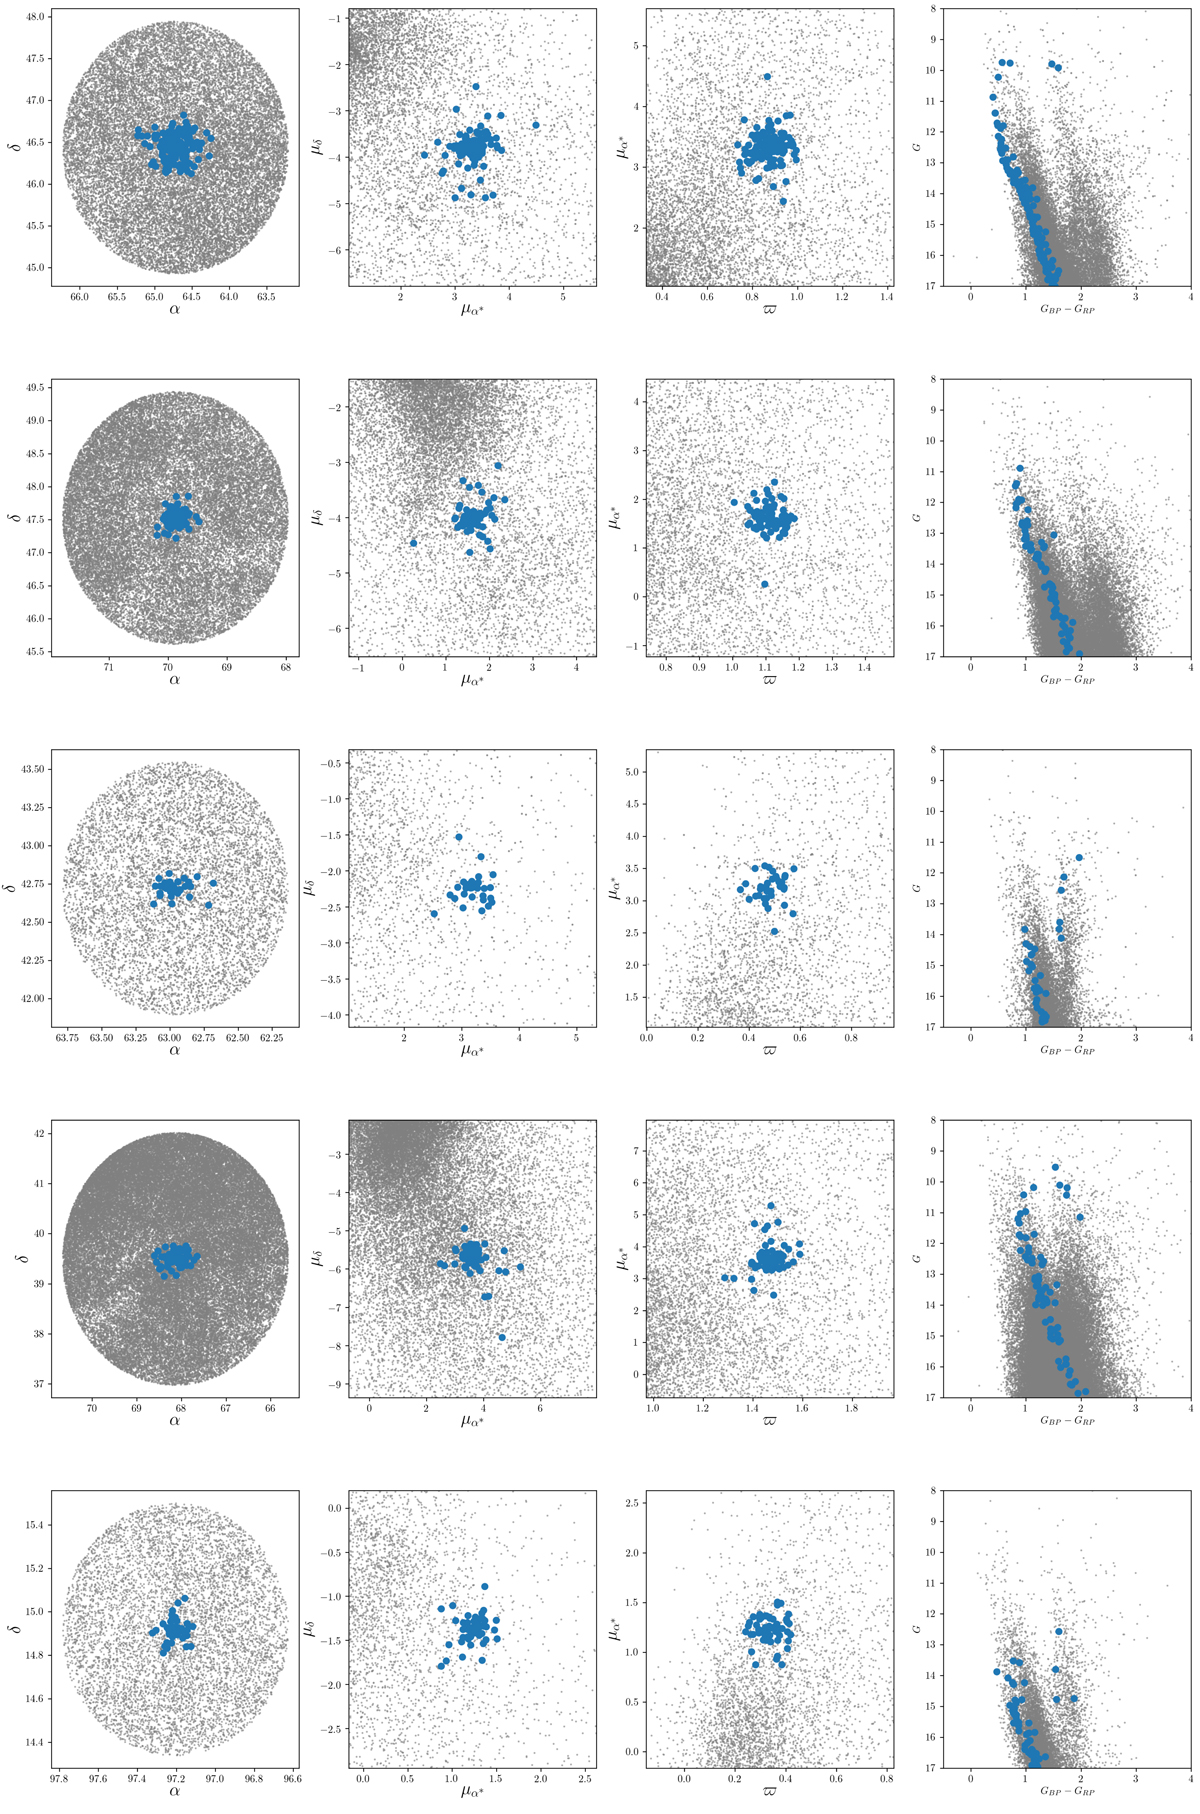
Five examples of the 53 detected OCs. The blue dots represent the detected members, while grey dots represent field stars. Leftmost plots: position of the OC in (α, δ). Inner left plots: (μα*, μδ) distribution, whilst inner right plots: (ϖ, μα*) distribution. Rightmost plots: CMD of each OC. The plotted OCs are, from top to bottom: UBC 54, UBC 56, UBC 57, UBC 60, and UBC 90. The first four clusters are class A and the last one is a class B cluster (see Table 1).
Current usage metrics show cumulative count of Article Views (full-text article views including HTML views, PDF and ePub downloads, according to the available data) and Abstracts Views on Vision4Press platform.
Data correspond to usage on the plateform after 2015. The current usage metrics is available 48-96 hours after online publication and is updated daily on week days.
Initial download of the metrics may take a while.