Free Access
Fig. 2.
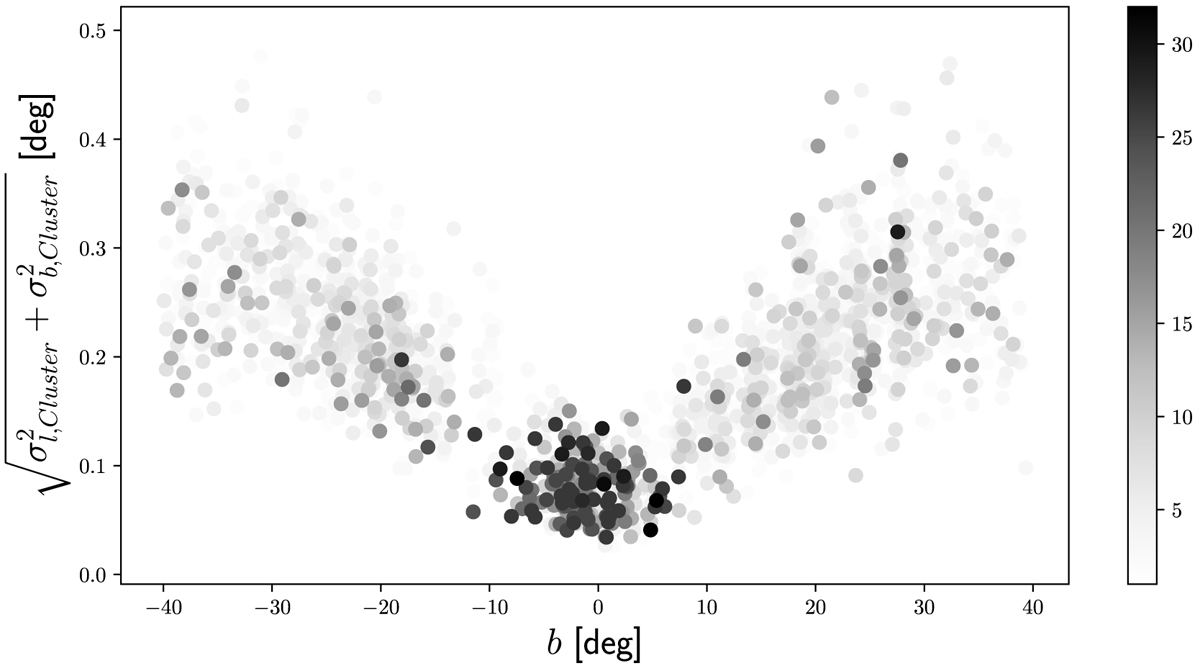
Cluster size as a function of the Galactic latitude (b). The greyscale represents how many times each cluster is found within the pairs of (L, minPts) explored. High latitude clusters are detected fewer times and are larger in size.
Current usage metrics show cumulative count of Article Views (full-text article views including HTML views, PDF and ePub downloads, according to the available data) and Abstracts Views on Vision4Press platform.
Data correspond to usage on the plateform after 2015. The current usage metrics is available 48-96 hours after online publication and is updated daily on week days.
Initial download of the metrics may take a while.