Open Access
Fig. 3.
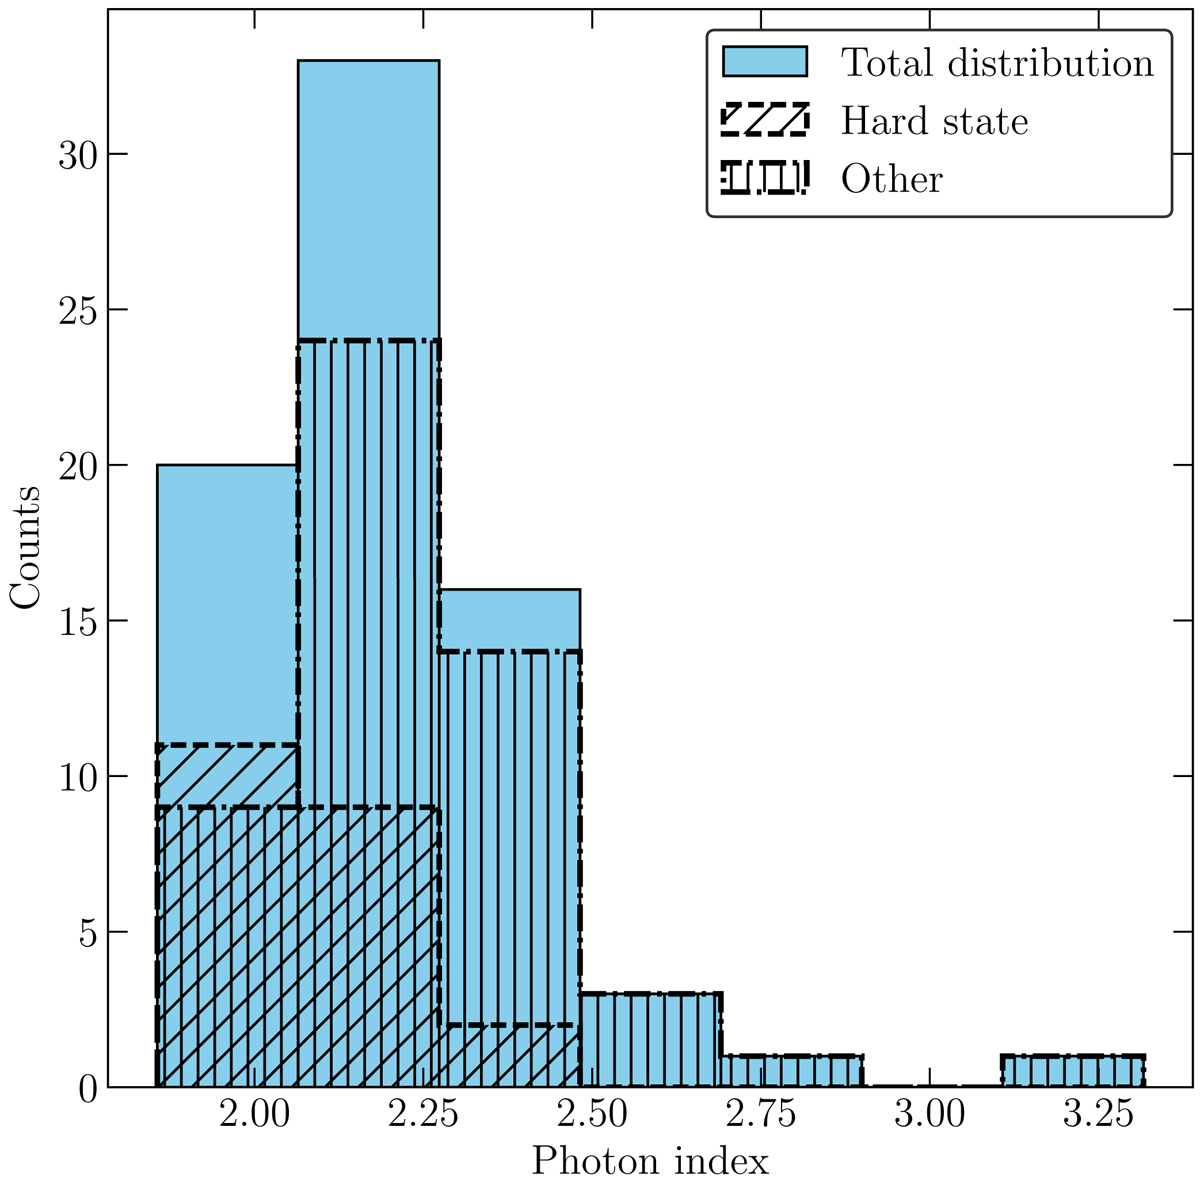
Histogram of photon index from the Fermi-LAT light curve shown in Fig. 1, for bins when it was fit as free parameter. The filled blue area represents the total distribution, while the hatched areas indicate the distributions for the hard state time interval and for all the other bins.
Current usage metrics show cumulative count of Article Views (full-text article views including HTML views, PDF and ePub downloads, according to the available data) and Abstracts Views on Vision4Press platform.
Data correspond to usage on the plateform after 2015. The current usage metrics is available 48-96 hours after online publication and is updated daily on week days.
Initial download of the metrics may take a while.