Fig. 11
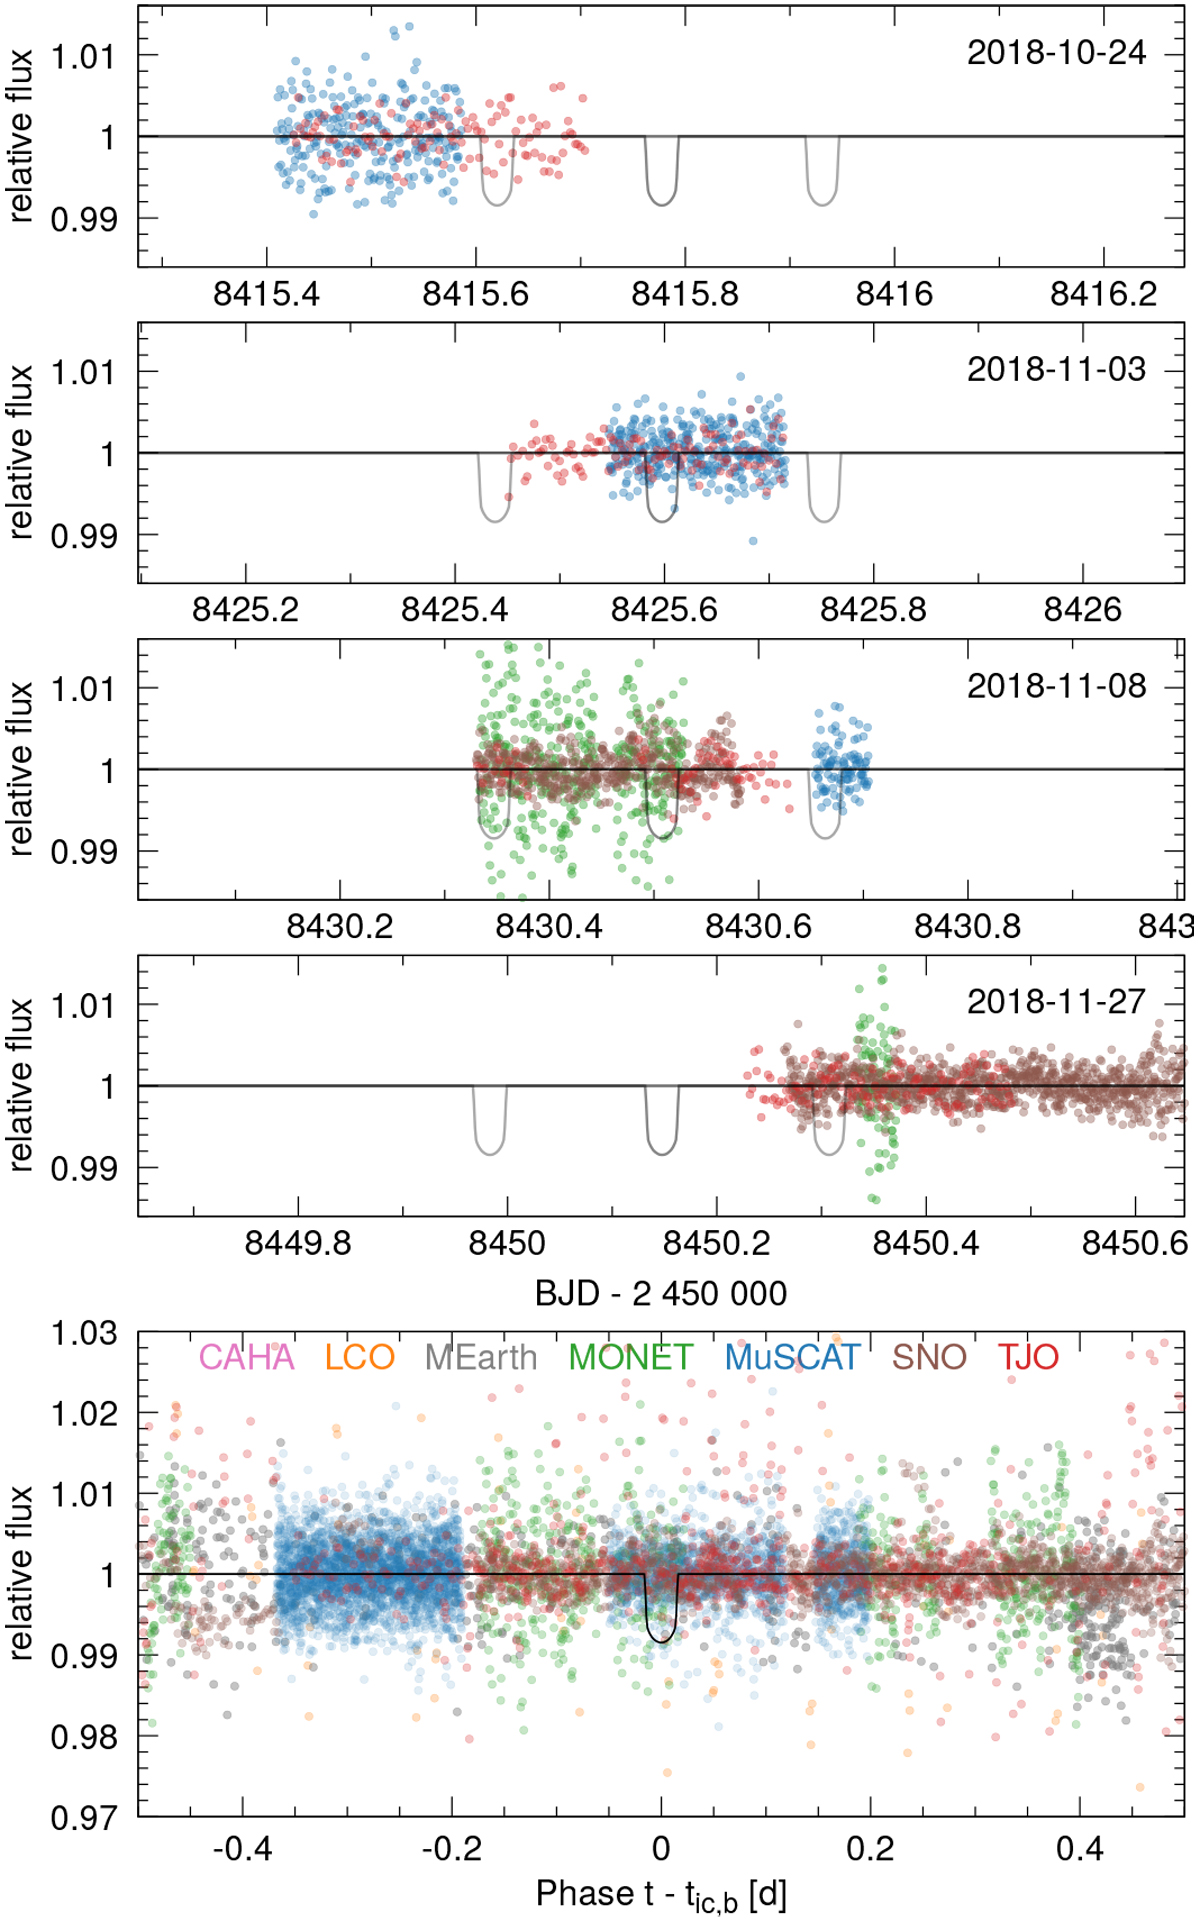
Transit search with various de-trended photometric data sets. Top panels: four high-cadence nights from the transit search. The transit model (black curve) shows the expected signal for planet b and for maximum transit depth. The left and right models (grey) indicate the predicted 1σ uncertainty for the transit window (0.15 d, 3.6 h). Bottom panel: all photometric data phase-folded with Pb and tic,b.
Current usage metrics show cumulative count of Article Views (full-text article views including HTML views, PDF and ePub downloads, according to the available data) and Abstracts Views on Vision4Press platform.
Data correspond to usage on the plateform after 2015. The current usage metrics is available 48-96 hours after online publication and is updated daily on week days.
Initial download of the metrics may take a while.