Fig. 6.
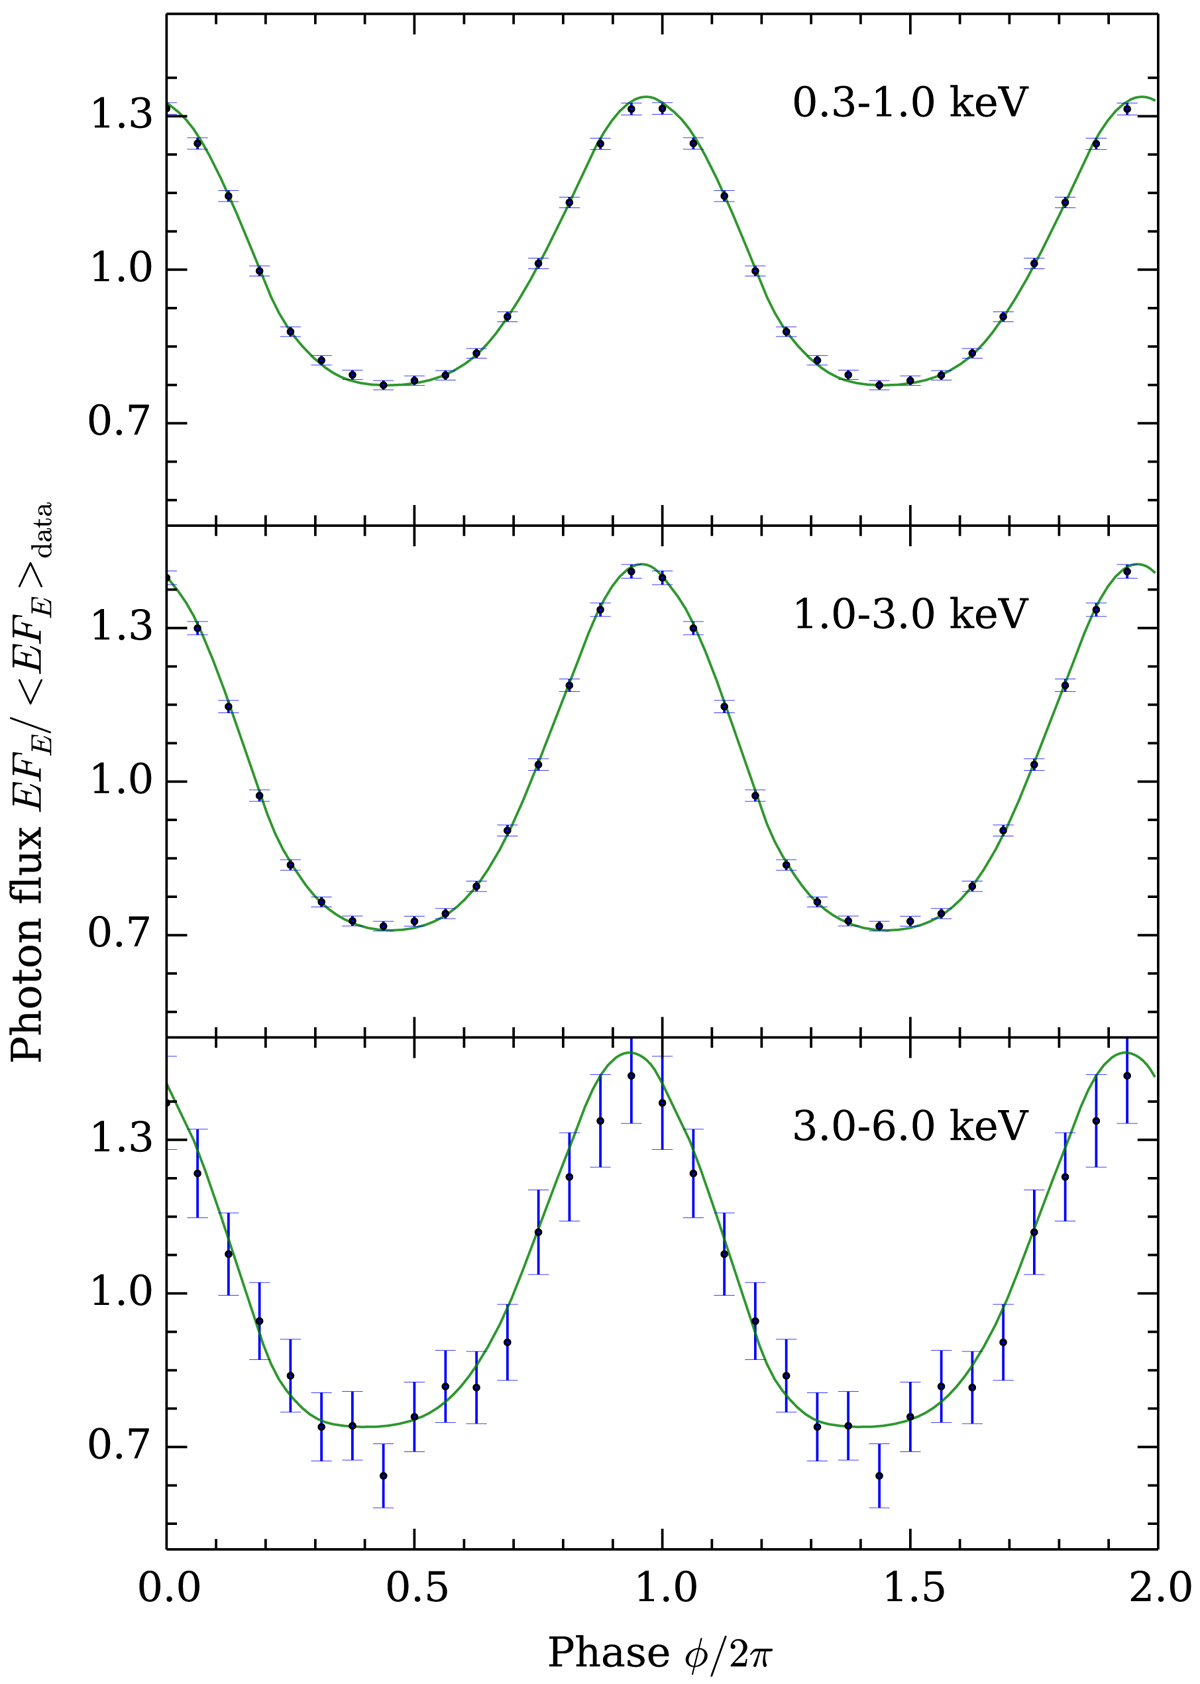
Normalised pulse profiles for the synthetic data simulated using full Compton model. For illustration the data are re-binned to 3 energy bins. The green solid-line shows the best-fit solution. The contours for posterior density credible regions are not shown as they are very precise and would overlap the line of the best-fit solution. The synthetic data converted to the physical units using the best-fit model are shown with blue circles, with the error bars shown according to the Poisson noise. The assumed calibration error of 1% is not shown in the error bars.
Current usage metrics show cumulative count of Article Views (full-text article views including HTML views, PDF and ePub downloads, according to the available data) and Abstracts Views on Vision4Press platform.
Data correspond to usage on the plateform after 2015. The current usage metrics is available 48-96 hours after online publication and is updated daily on week days.
Initial download of the metrics may take a while.