Fig. 4.
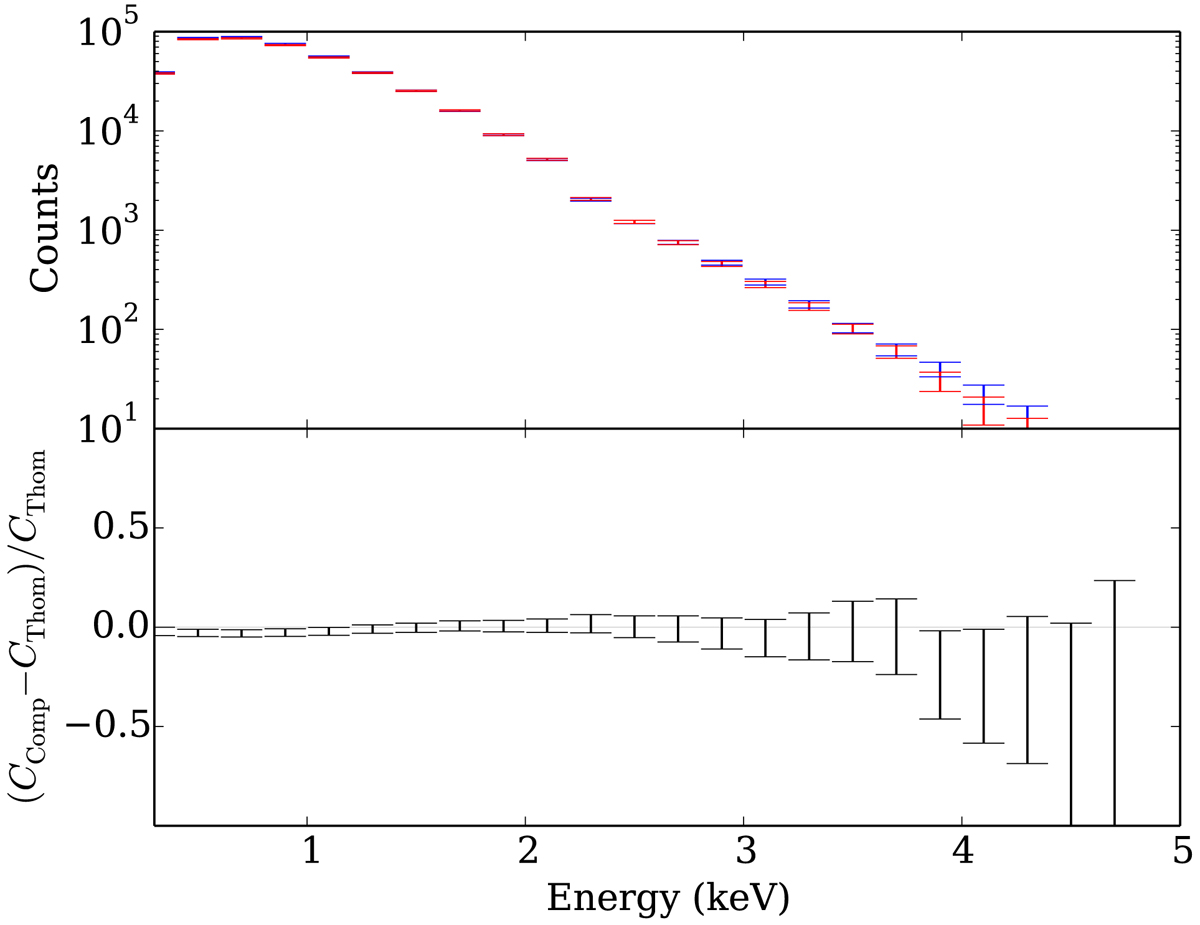
Upper panel: comparison of two phase-averaged synthetic spectra in terms of counts detected by NICER with T = 2.0 MK, and one week exposure time of object similar to PSR J0437−4715. The other parameters of the model are the same as explained in Sect. 2 (e.g. the spot size remains 5.0°). The blue bars are calculated with the Thomson model MCPHAC and the red bars are for our full Compton model. Every twenty adjacent NICER energy bins are combined to one bin. A calibration error of 1% is assumed. Lower panel: relative difference of the counts predicted by the two models. The error bars correspond to the combined error of the two data points in a given energy bin relative to the observed counts of Thomson model, calculated by ![]() .
.
Current usage metrics show cumulative count of Article Views (full-text article views including HTML views, PDF and ePub downloads, according to the available data) and Abstracts Views on Vision4Press platform.
Data correspond to usage on the plateform after 2015. The current usage metrics is available 48-96 hours after online publication and is updated daily on week days.
Initial download of the metrics may take a while.