Fig. 2.
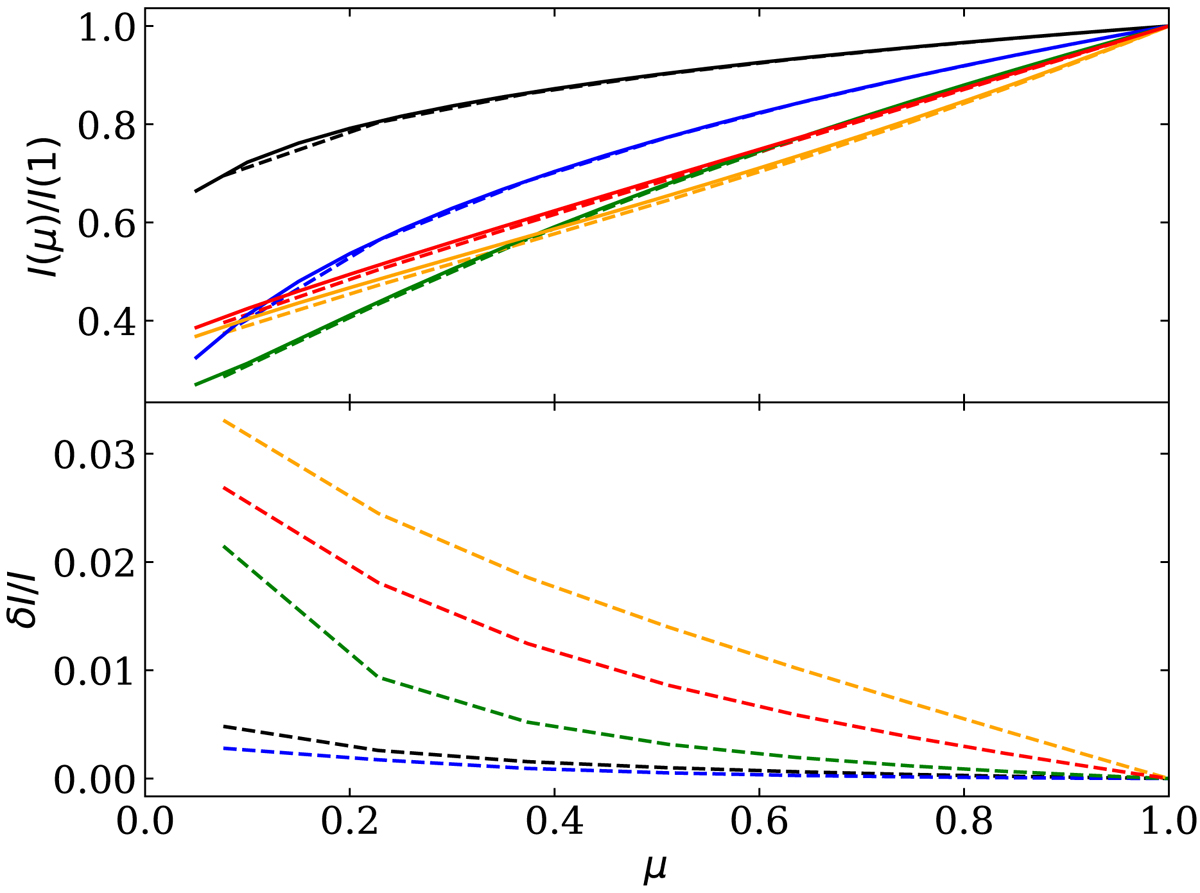
Upper panel: angular distribution of the specific intensity as a function of the cosine of the zenith angle μ for the NS atmosphere parameters given in Fig. 1. The outputs of our code (using the Thomson approximation) and those of the MCPHAC code are marked by solid- and dashed-lines, respectively. The black, blue, green, orange, and red colors correspond to 0.1, 0.5, 1.0, 5.0, and 10.0 keV, respectively. Lower panel: relative difference between the normalised angular distributions is shown.
Current usage metrics show cumulative count of Article Views (full-text article views including HTML views, PDF and ePub downloads, according to the available data) and Abstracts Views on Vision4Press platform.
Data correspond to usage on the plateform after 2015. The current usage metrics is available 48-96 hours after online publication and is updated daily on week days.
Initial download of the metrics may take a while.