Fig. 1.
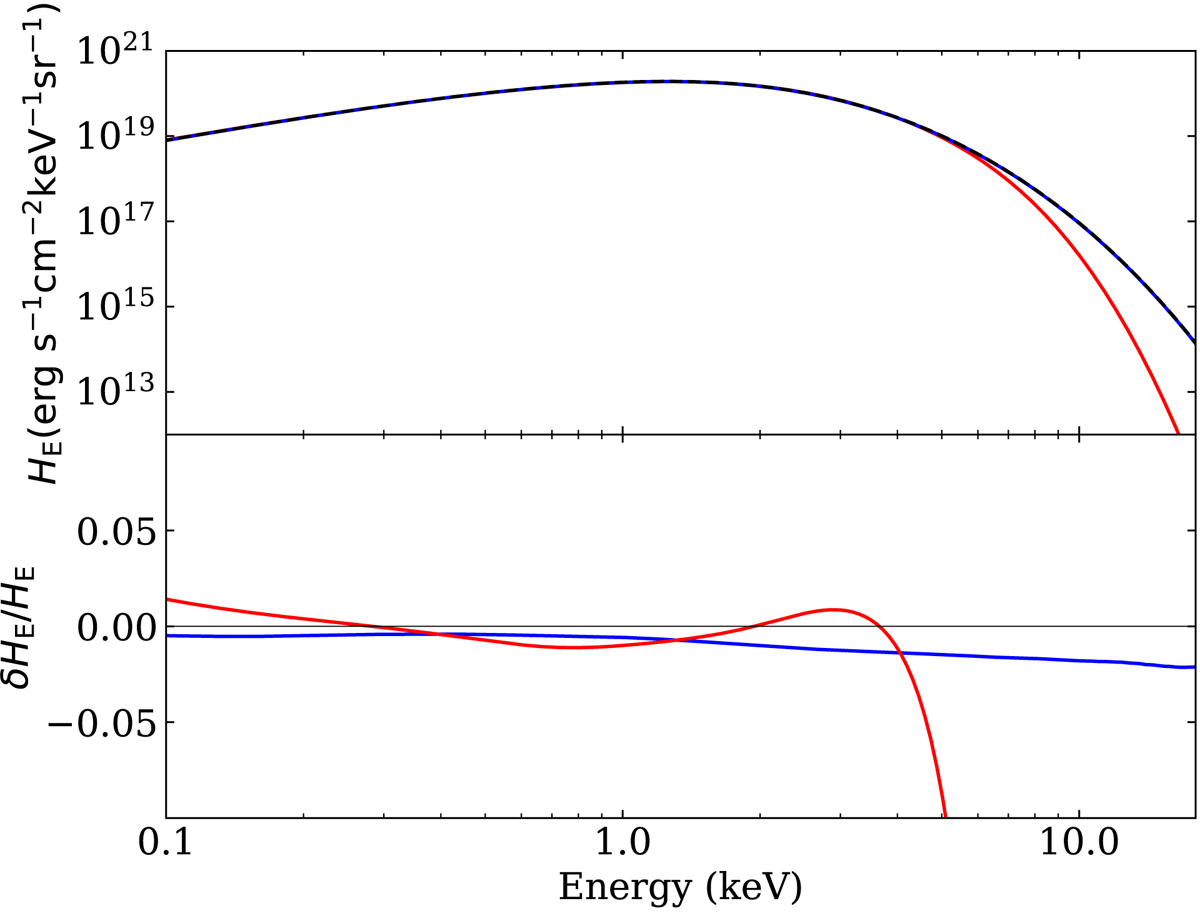
Upper panel: model spectral energy distributions of first moment of specific intensity HE for pure hydrogen NS atmosphere models with T = 3.1623 MK and logg = 14.3856. The outputs of the codes that use the Thomson approximation for Compton scattering are represented by the blue solid-line (our code) and black dashed-line (MCPHAC code), while the red solid-line represents the output of our code when the full treatment of Compton scattering is used. Lower panel: relative difference between our model results in the Thomson (blue) and full Compton (red) limits compared to those of the MCPHAC code.
Current usage metrics show cumulative count of Article Views (full-text article views including HTML views, PDF and ePub downloads, according to the available data) and Abstracts Views on Vision4Press platform.
Data correspond to usage on the plateform after 2015. The current usage metrics is available 48-96 hours after online publication and is updated daily on week days.
Initial download of the metrics may take a while.