Free Access
Fig. 4.
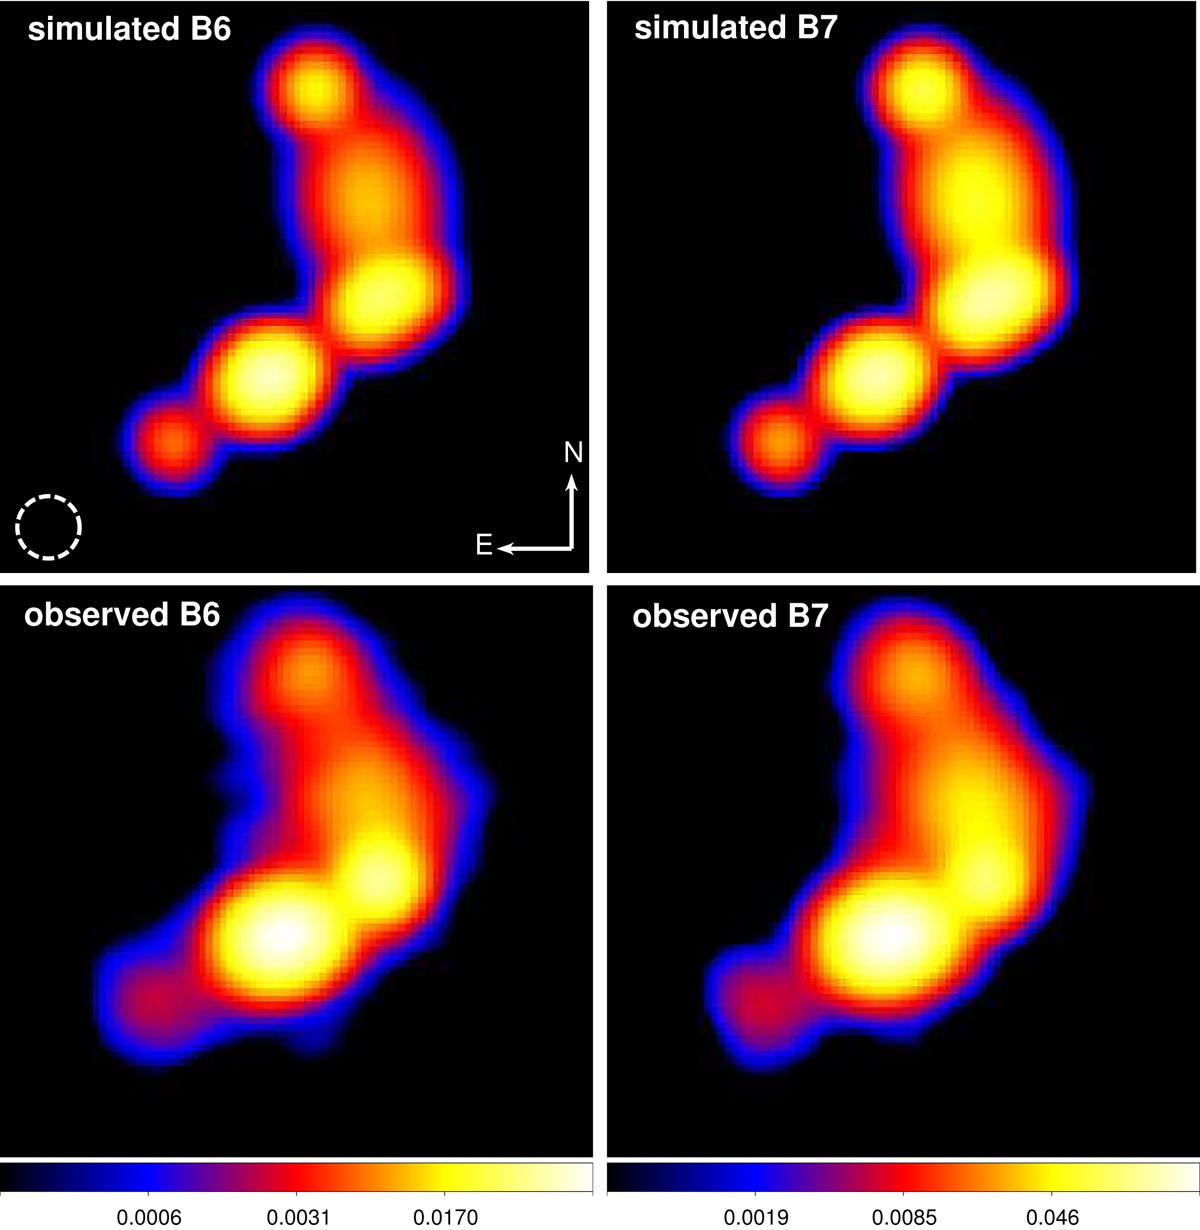
Simulated and observed maps of continuum emission of VY CMa. All images are in scale and were generated with a beam of 152 mas FWHM (dashed line). Observed and simulated images in each band are displayed in the same logarithmic color scale (in Jy/beam).
Current usage metrics show cumulative count of Article Views (full-text article views including HTML views, PDF and ePub downloads, according to the available data) and Abstracts Views on Vision4Press platform.
Data correspond to usage on the plateform after 2015. The current usage metrics is available 48-96 hours after online publication and is updated daily on week days.
Initial download of the metrics may take a while.