Fig. 3.
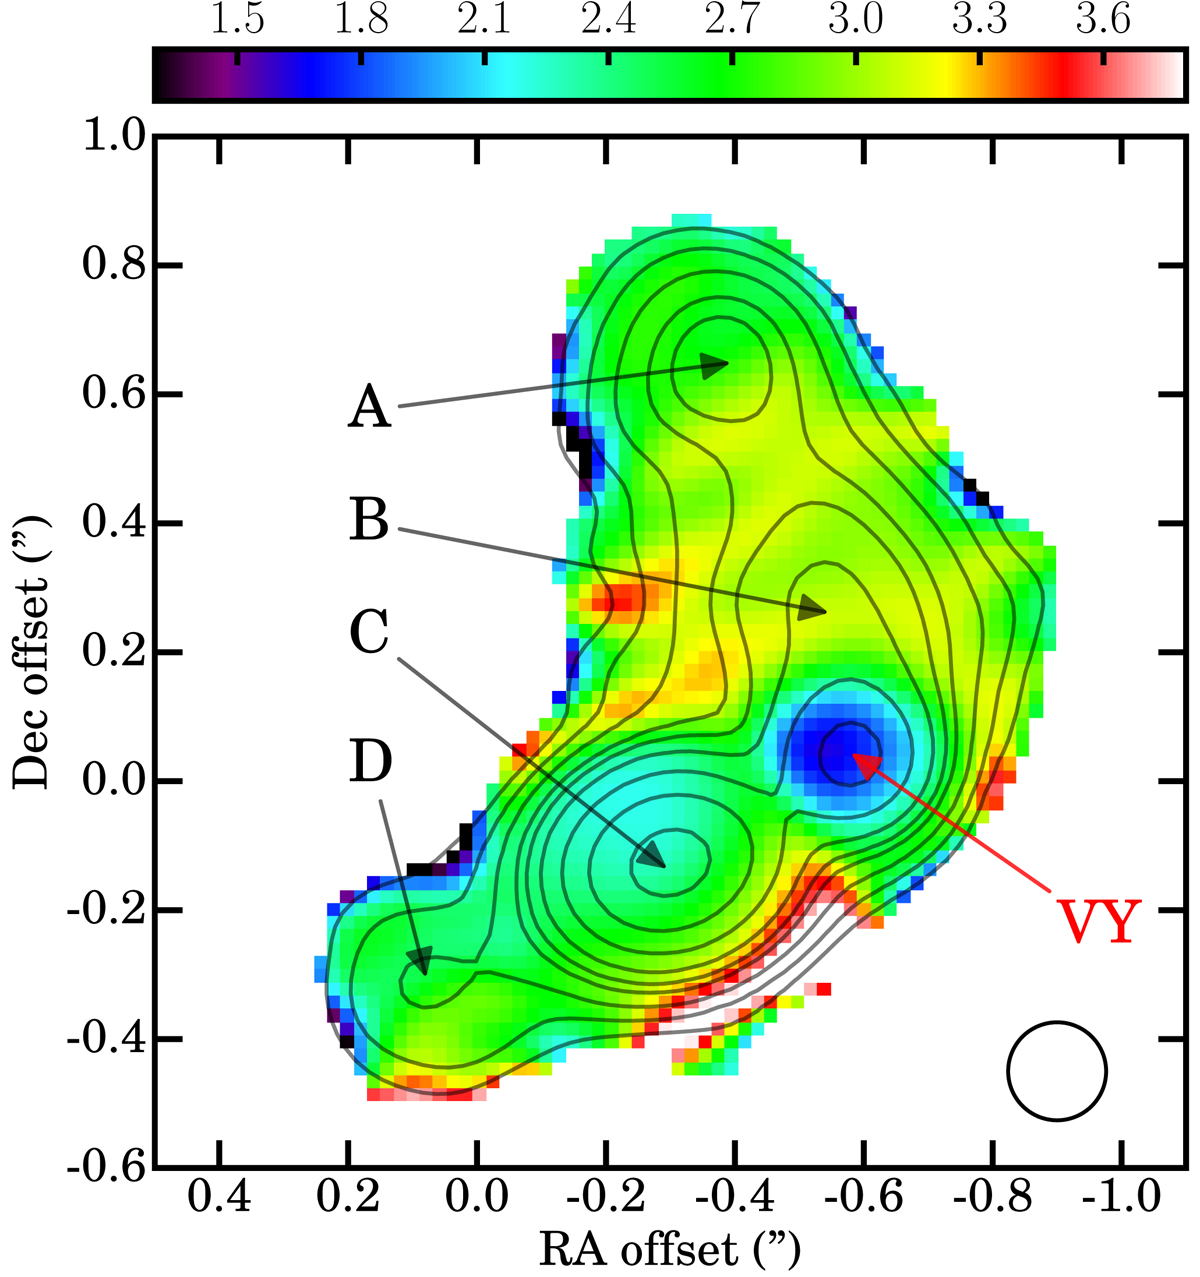
Spectral index map of the continuum emission of VY CMa between about 230.3 and 351.4 GHz. Contours represent continuum emission in Band 6 at 0.5 (≈5× rms of the map noise), 1, 2, 4, 6, 10, 20, 40, and 80% of the peak flux of 95 mJy beam−1. The restoring beam size is shown in the lower right corner. The naming convention for the clumps is indicated by the labels and arrows. At 1.17 kpc, 100 mas corresponds to 117 AU.
Current usage metrics show cumulative count of Article Views (full-text article views including HTML views, PDF and ePub downloads, according to the available data) and Abstracts Views on Vision4Press platform.
Data correspond to usage on the plateform after 2015. The current usage metrics is available 48-96 hours after online publication and is updated daily on week days.
Initial download of the metrics may take a while.