Fig. 2.
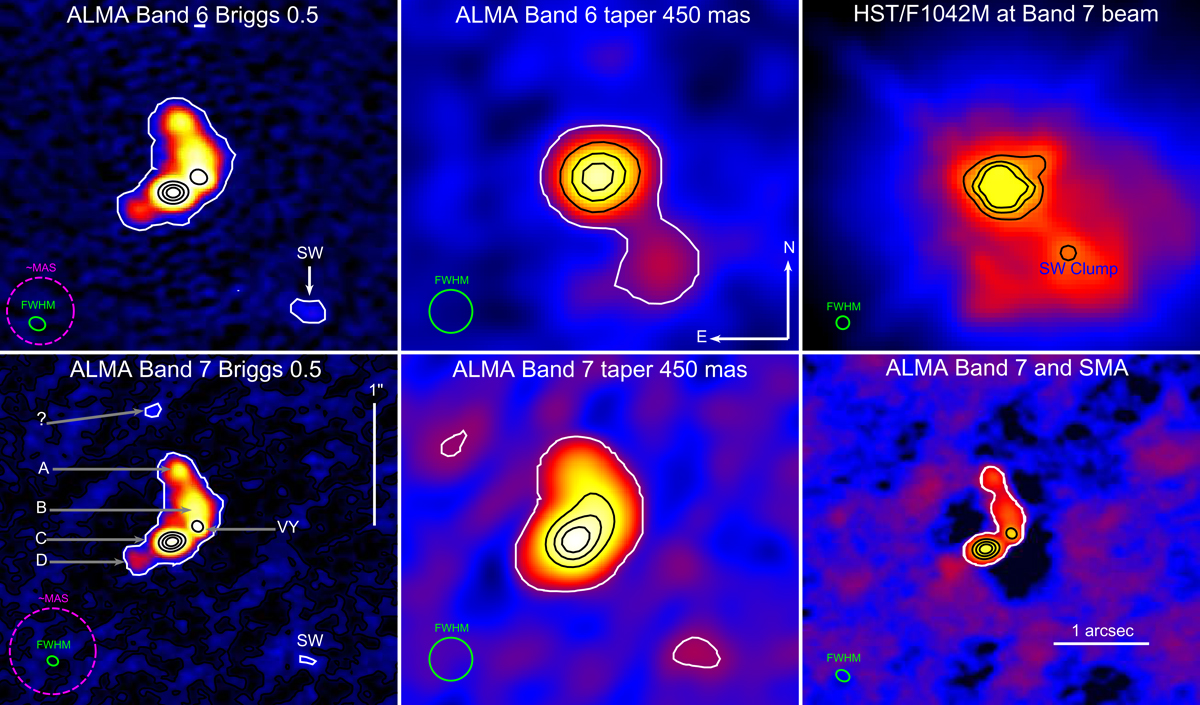
Maps of continuum emission of the VY CMa dusty envelope. Left: maps of emission imaged with ALMA Bands 6 (top) and 7 (bottom) at Briggs weighting (robust 0.5). Middle: corresponding data imaged with a UV taper, which reduced the resolution to a FWHM of 450 mas. Top right: HST image at 1 μm smoothed to the angular resolution of ALMA Band 7 observations. Bottom right: map generated from combined visibilities of ALMA and SMA. The corresponding spatial resolution (FWHM) of each map is shown with a green ellipse in the lower left corners. Left panels: we additionally show the size of the largest angular scales. White contours are drawn at the respective 5σ levels. Black contours are shown at 3 levels spaced linearly from the peak to zero intensity (excluding zero).
Current usage metrics show cumulative count of Article Views (full-text article views including HTML views, PDF and ePub downloads, according to the available data) and Abstracts Views on Vision4Press platform.
Data correspond to usage on the plateform after 2015. The current usage metrics is available 48-96 hours after online publication and is updated daily on week days.
Initial download of the metrics may take a while.