Fig. 1.
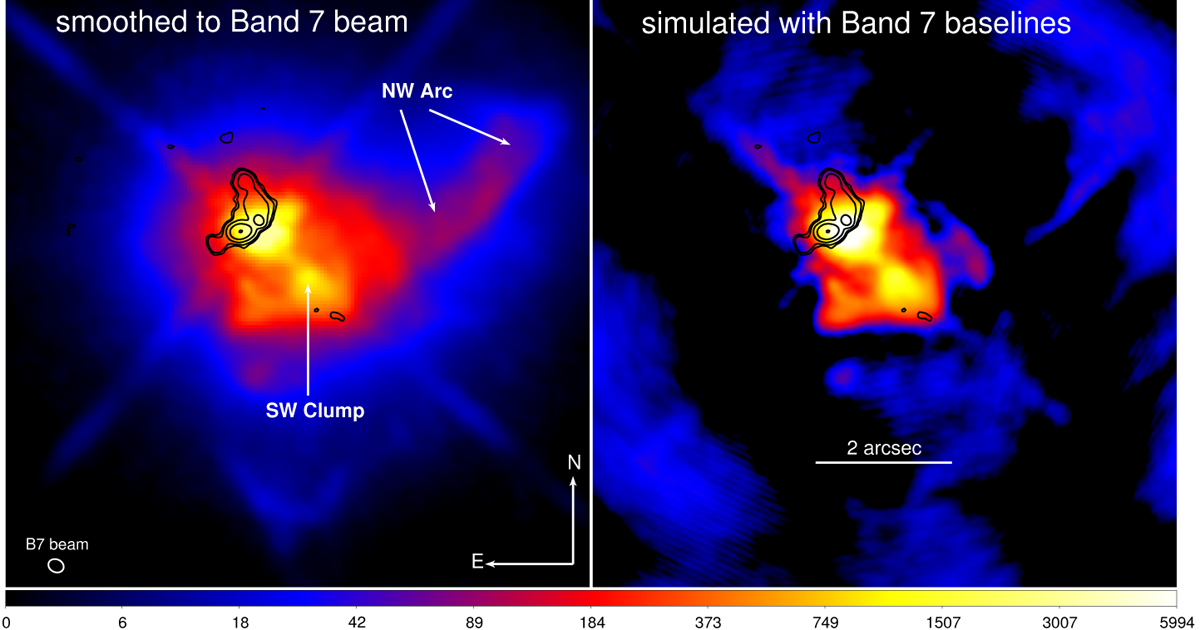
Image of the VY CMa nebula from HST/F1042M. The image shows mainly scattered light at 1 μm (and the HST diffraction cross). The left image was smoothed to the Gaussian beam of our Band 7 ALMA observations. The right image was processed with a spatial-frequency filter consistent with the ALMA array configuration used in ALMA observations. The largest features, (e.g., NW Arc) are filtered out and some other structures are buried in an irregular pattern introduced by a complex interferometer response function. The color scale for both images is in counts per second. Black contours show continuum emission observed in Band 7. The contours are drawn from 0.4% (∼5σ) to 97% of the peak emission with a logarithmic step in each contour.
Current usage metrics show cumulative count of Article Views (full-text article views including HTML views, PDF and ePub downloads, according to the available data) and Abstracts Views on Vision4Press platform.
Data correspond to usage on the plateform after 2015. The current usage metrics is available 48-96 hours after online publication and is updated daily on week days.
Initial download of the metrics may take a while.