Fig. 2.
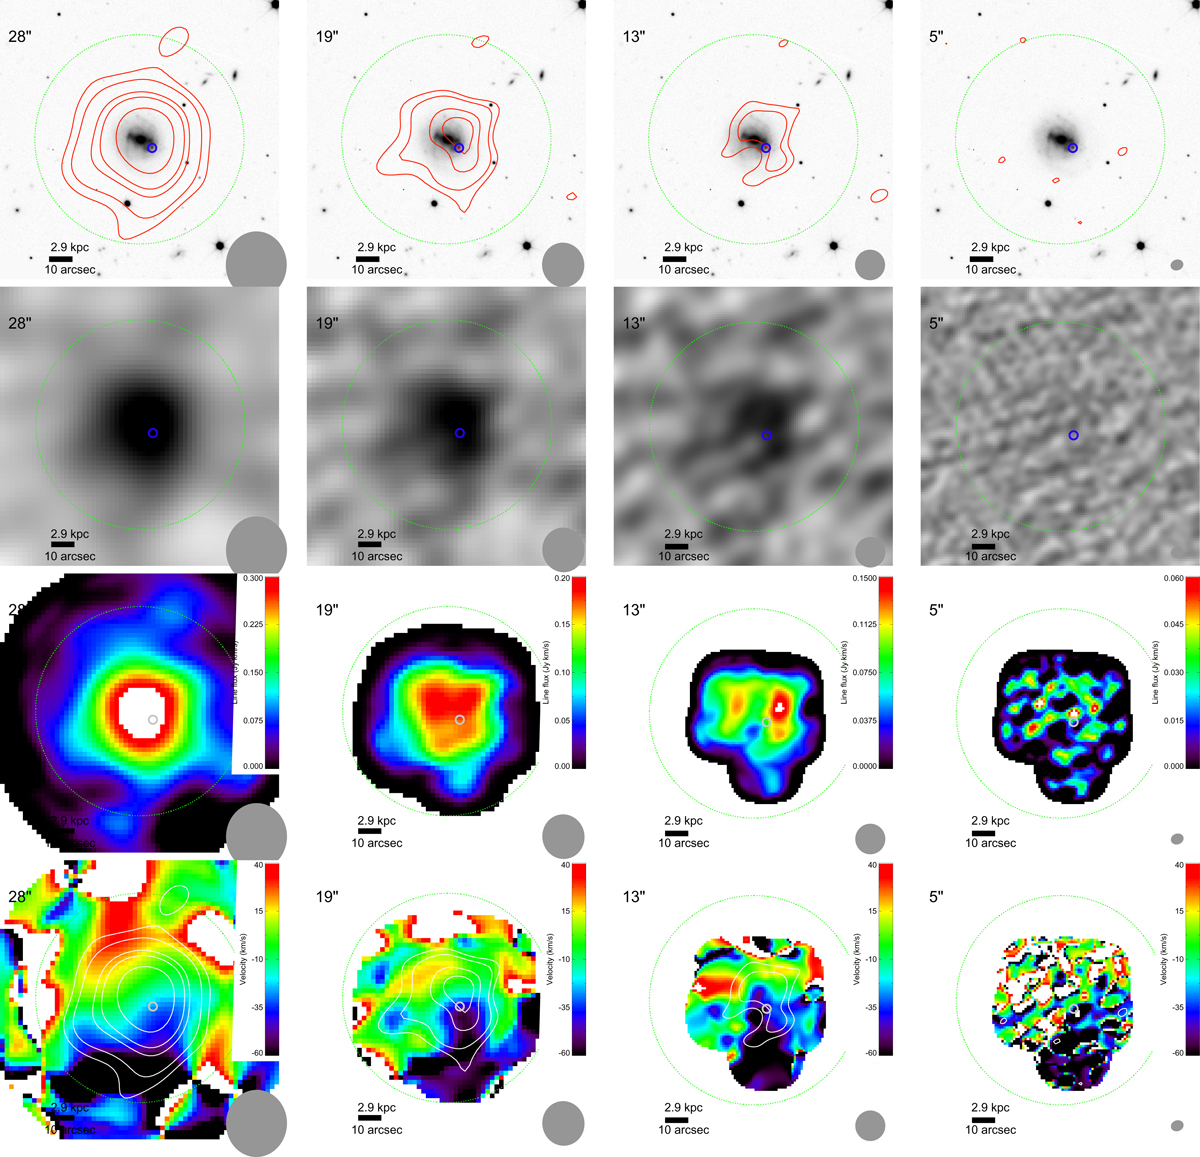
Top: HI contours (red; collapsed HI cube) of CGCG 137-068 overlaid on the Gran Telescopio Canarias optical i′-band image (Kann et al., in prep.). The contours are 3, 4, 6, 7, and 9σ, where σ = 0.031, 0.029, 0.027, and 0.019 Jy beam−1 km s−1 for the data at the resolution of 28″, 19″, 13″, and 5″, respectively (corresponding to a neutral hydrogen column density of ∼0.5, 0.9, 1.8, and 8.4 × 1020 cm2, respectively). Second row: HI data cube collapsed within the dotted lines given in Fig. 1. Third row: zeroth-moment map (integrated emission) of the HI line. Bottom: first-moment map (velocity field) of the HI line with the same contours as in the top panel. The velocities are relative to the systemic velocity of 4197 km s−1 derived from the optical spectrum (Perley et al. 2019). Columns are for the resolution as marked in the panels. The VLBI position of AT 2018cow is indicated by the blue or grey circles. The green dotted circle has a radius of 45″ and corresponds to the aperture within which the total HI emission was measured. The beam size of the HI data is shown as the grey ellipses. The images are 120″ × 120″ , and the scale is indicated by the ruler. North is up and east is to the left.
Current usage metrics show cumulative count of Article Views (full-text article views including HTML views, PDF and ePub downloads, according to the available data) and Abstracts Views on Vision4Press platform.
Data correspond to usage on the plateform after 2015. The current usage metrics is available 48-96 hours after online publication and is updated daily on week days.
Initial download of the metrics may take a while.