Fig. 4
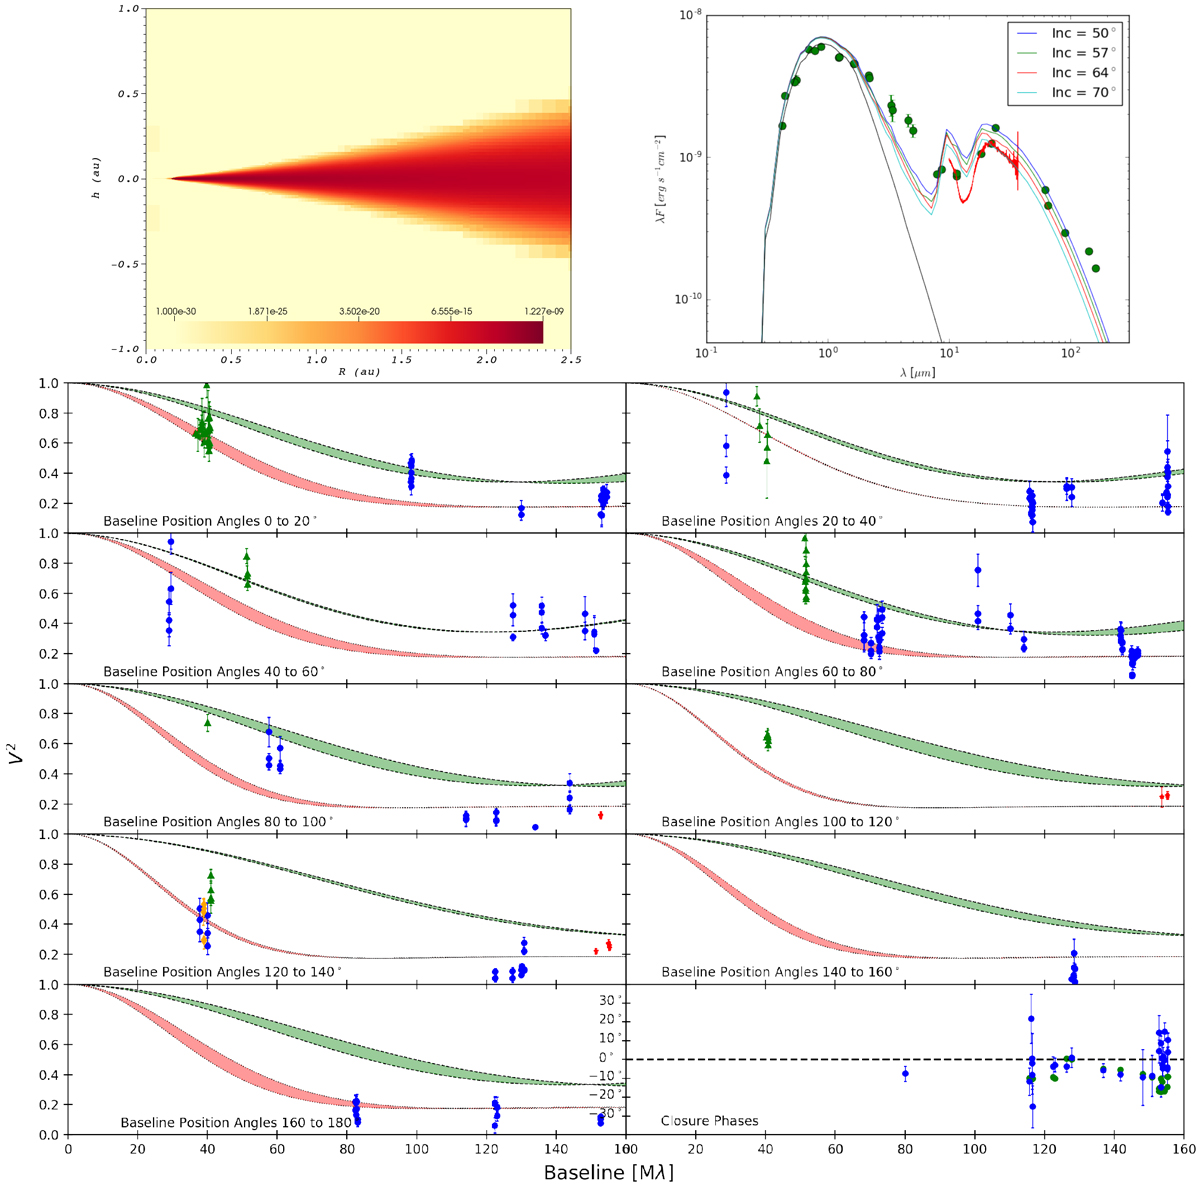
Results of radiative transfer and geometric modelling with the IN05 disk rim prescription (Isella & Natta 2005) of a gas density-dependent sublimation temperature with a single grain species size 0.1 μm . Top left: disk density cross section of the inner rim. A logarithmic colour scale is used with a minimum density of 1.00 × 10⁻³⁰ to a maximum of 4.64 × 10⁻¹⁰. Top right:SED computed with our radiative transfer model. Dark blue curve is the simulated blackbody emission of the central star. Green points are photometric observations while the short red line is the Spitzer spectrum. The coloured curves represent the SED at the different inclinations of 50, 57, 64 and 70°. Bottom: visibility data binned by position angle of observation. The data points are split by instrument consistently with Figs. 1 and 2, where blue circles are from CHARA/CLIMB, red stars are from CHARA/CLASSIC, green triangles from PTI and orange diamonds from KI. The red curves are the results of the best fit geometricskewed ring model and the green curves are calculated from the radiative transfer image at an inclination of 50° and a position angle of 60°. The dashed bounding lines indicate the minimum and maximum model visibilities for that position angle bin. The very bottom right panel shows the observed CP measurements (black) and the CP computed from the radiative transfer image (green).
Current usage metrics show cumulative count of Article Views (full-text article views including HTML views, PDF and ePub downloads, according to the available data) and Abstracts Views on Vision4Press platform.
Data correspond to usage on the plateform after 2015. The current usage metrics is available 48-96 hours after online publication and is updated daily on week days.
Initial download of the metrics may take a while.