Fig. 3
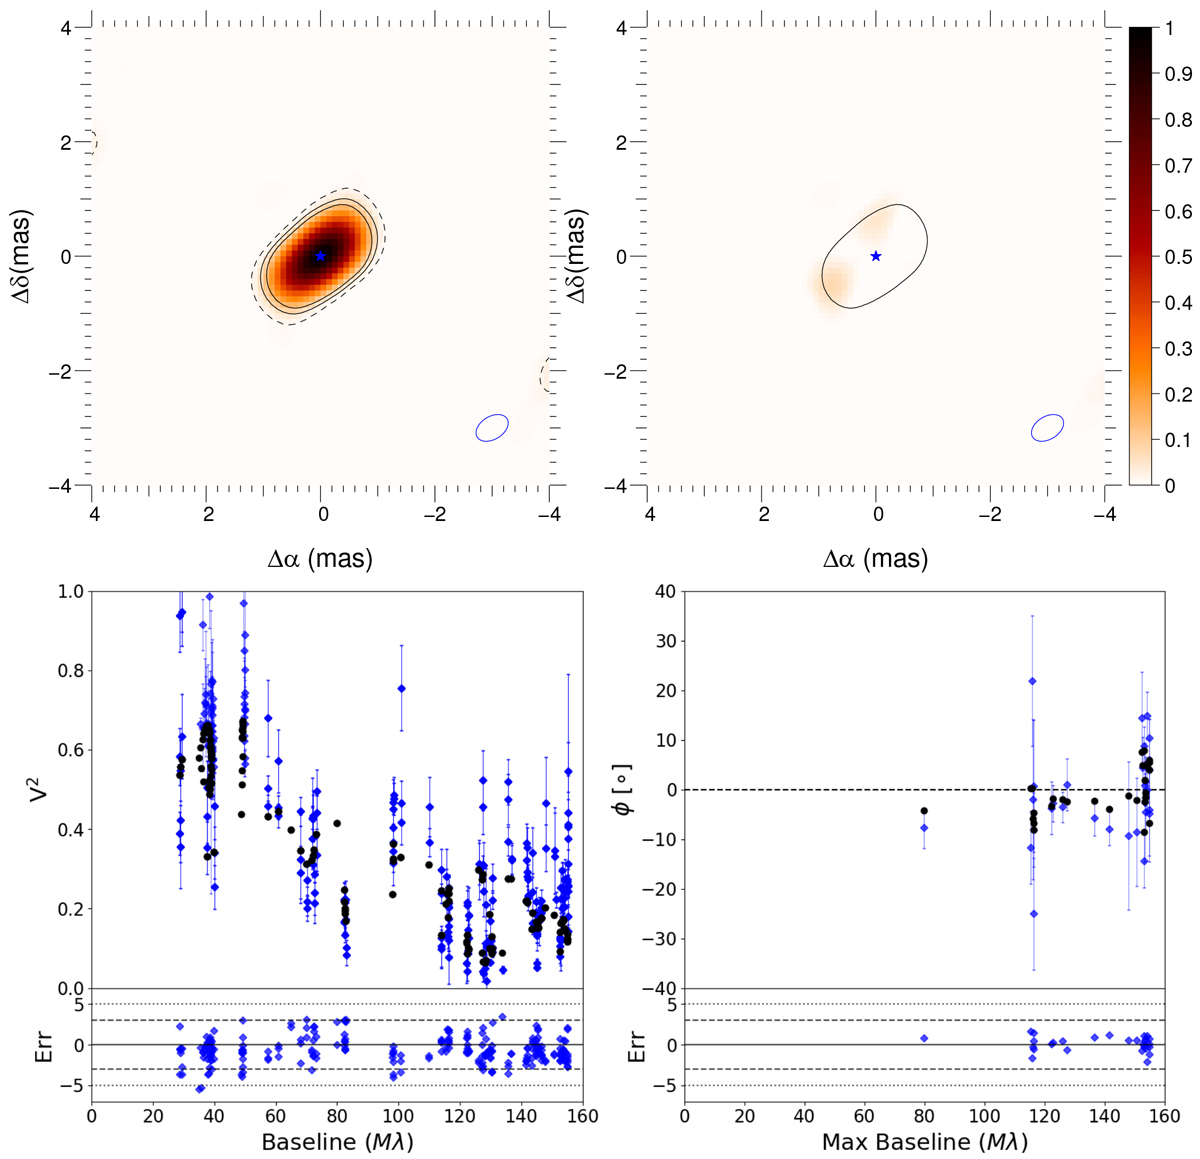
Top left: resultant reconstructed image showing the 3 and 5σ significance levels as solid black lines and the 1σ level as dashed lines. The beam size is shown in the bottom right. The colour bar is the same for both maps, with the maximum intensity normalised to 1 for the sake of readability. Top right: extracted asymmetry in the intensity map shown with 3σ significance level. Bottom left: fitted visibilities, data shown in black with model visibility in blue. Bottom right: fitted closure phases, data shown in black with model CP in blue. The residuals normalised to the standard deviation are plotted in the bottom of each graph.
Current usage metrics show cumulative count of Article Views (full-text article views including HTML views, PDF and ePub downloads, according to the available data) and Abstracts Views on Vision4Press platform.
Data correspond to usage on the plateform after 2015. The current usage metrics is available 48-96 hours after online publication and is updated daily on week days.
Initial download of the metrics may take a while.