Fig. 1
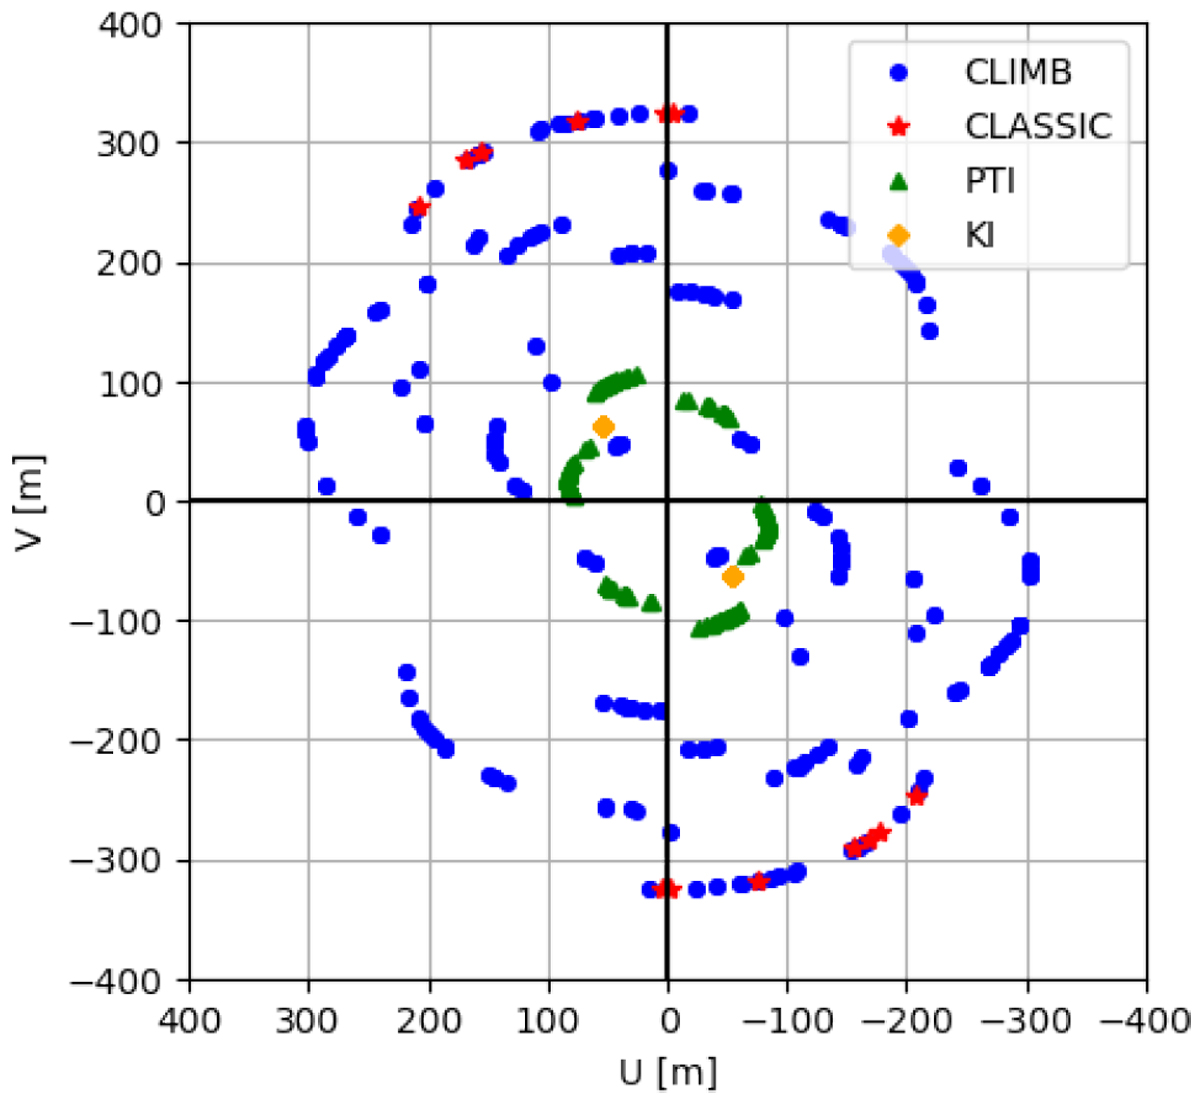
Coverage of the uv plane of the interferometric observations. Blue points represent observations using the CLIMB instrument, while red stars represent the CLASSIC instrument at the CHARA array. Yellow triangles represent observations using the Keck interferometer in 2011 and green triangles using the PTI with dates between 1999 and 2004.
Current usage metrics show cumulative count of Article Views (full-text article views including HTML views, PDF and ePub downloads, according to the available data) and Abstracts Views on Vision4Press platform.
Data correspond to usage on the plateform after 2015. The current usage metrics is available 48-96 hours after online publication and is updated daily on week days.
Initial download of the metrics may take a while.