Fig. 9
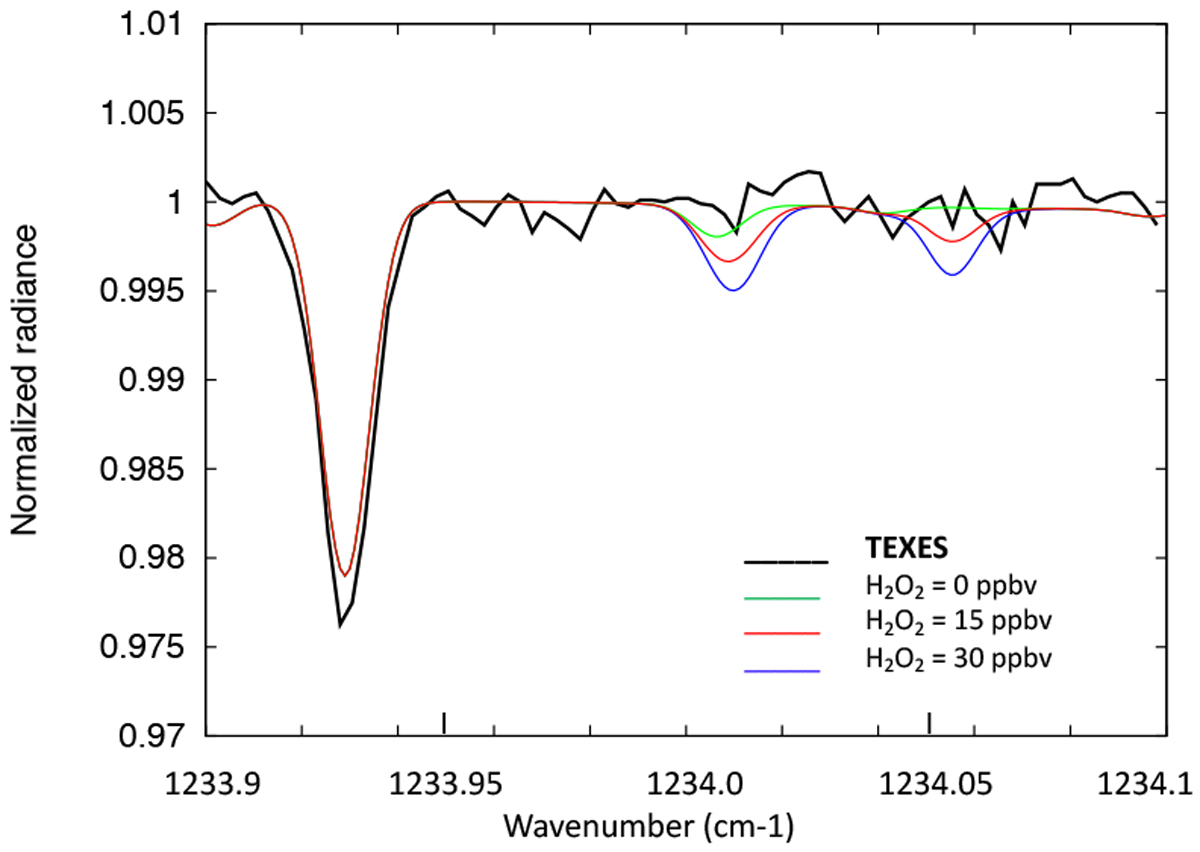
Black line: averaged disk-integrated spectra of Mars between 1233.90 and 1234.10 cm−1, obtained from the summation of the four spectra shown in Fig. 7. For the July 6 spectrum, a spike appeared at the position of the CO2 line at 1233.93 cm−1, so the averaged CO2 line was obtained from the summation of the three other spectra. Synthetic models were calculated using the atmospheric parameters described in Sect. 3.1, with H2O2 = 0 ppbv (green line), 15 ppbv (red line), and 30 ppbv (blue line). H2O2 is undetected, with a 2σ upper limit of 15 ppbv. The spectral resolution of the models is 0.014 cm−1.
Current usage metrics show cumulative count of Article Views (full-text article views including HTML views, PDF and ePub downloads, according to the available data) and Abstracts Views on Vision4Press platform.
Data correspond to usage on the plateform after 2015. The current usage metrics is available 48-96 hours after online publication and is updated daily on week days.
Initial download of the metrics may take a while.