Fig. 7
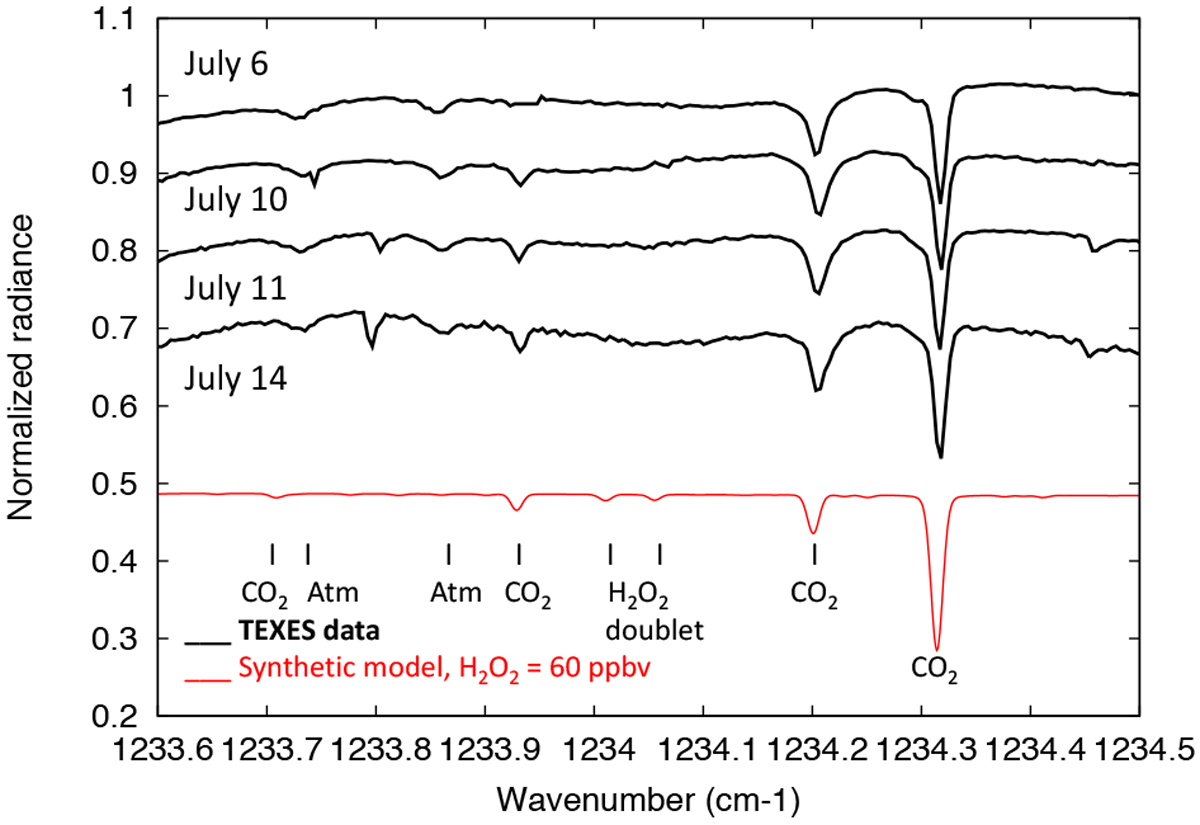
Black lines: normalized disk-integrated spectra of Mars between 1233.6 and 1234.5 cm−1, recorded on July 6, 10, 11, and 14, 2018, shifted vertically by 0.0, −0.1, −0.2, and −0.3, respectively. In the July 6 spectrum, a spike was present at 1233.93 cm−1, at the position of the CO2 line, and has been removed. Red line: synthetic model, calculated using the atmospheric parameters described in Sect. 3.1, with H2O2 = 60 ppbv, shifted by −0.5. The spectral resolution of the models is 0.014 cm−1.
Current usage metrics show cumulative count of Article Views (full-text article views including HTML views, PDF and ePub downloads, according to the available data) and Abstracts Views on Vision4Press platform.
Data correspond to usage on the plateform after 2015. The current usage metrics is available 48-96 hours after online publication and is updated daily on week days.
Initial download of the metrics may take a while.