Fig. 4
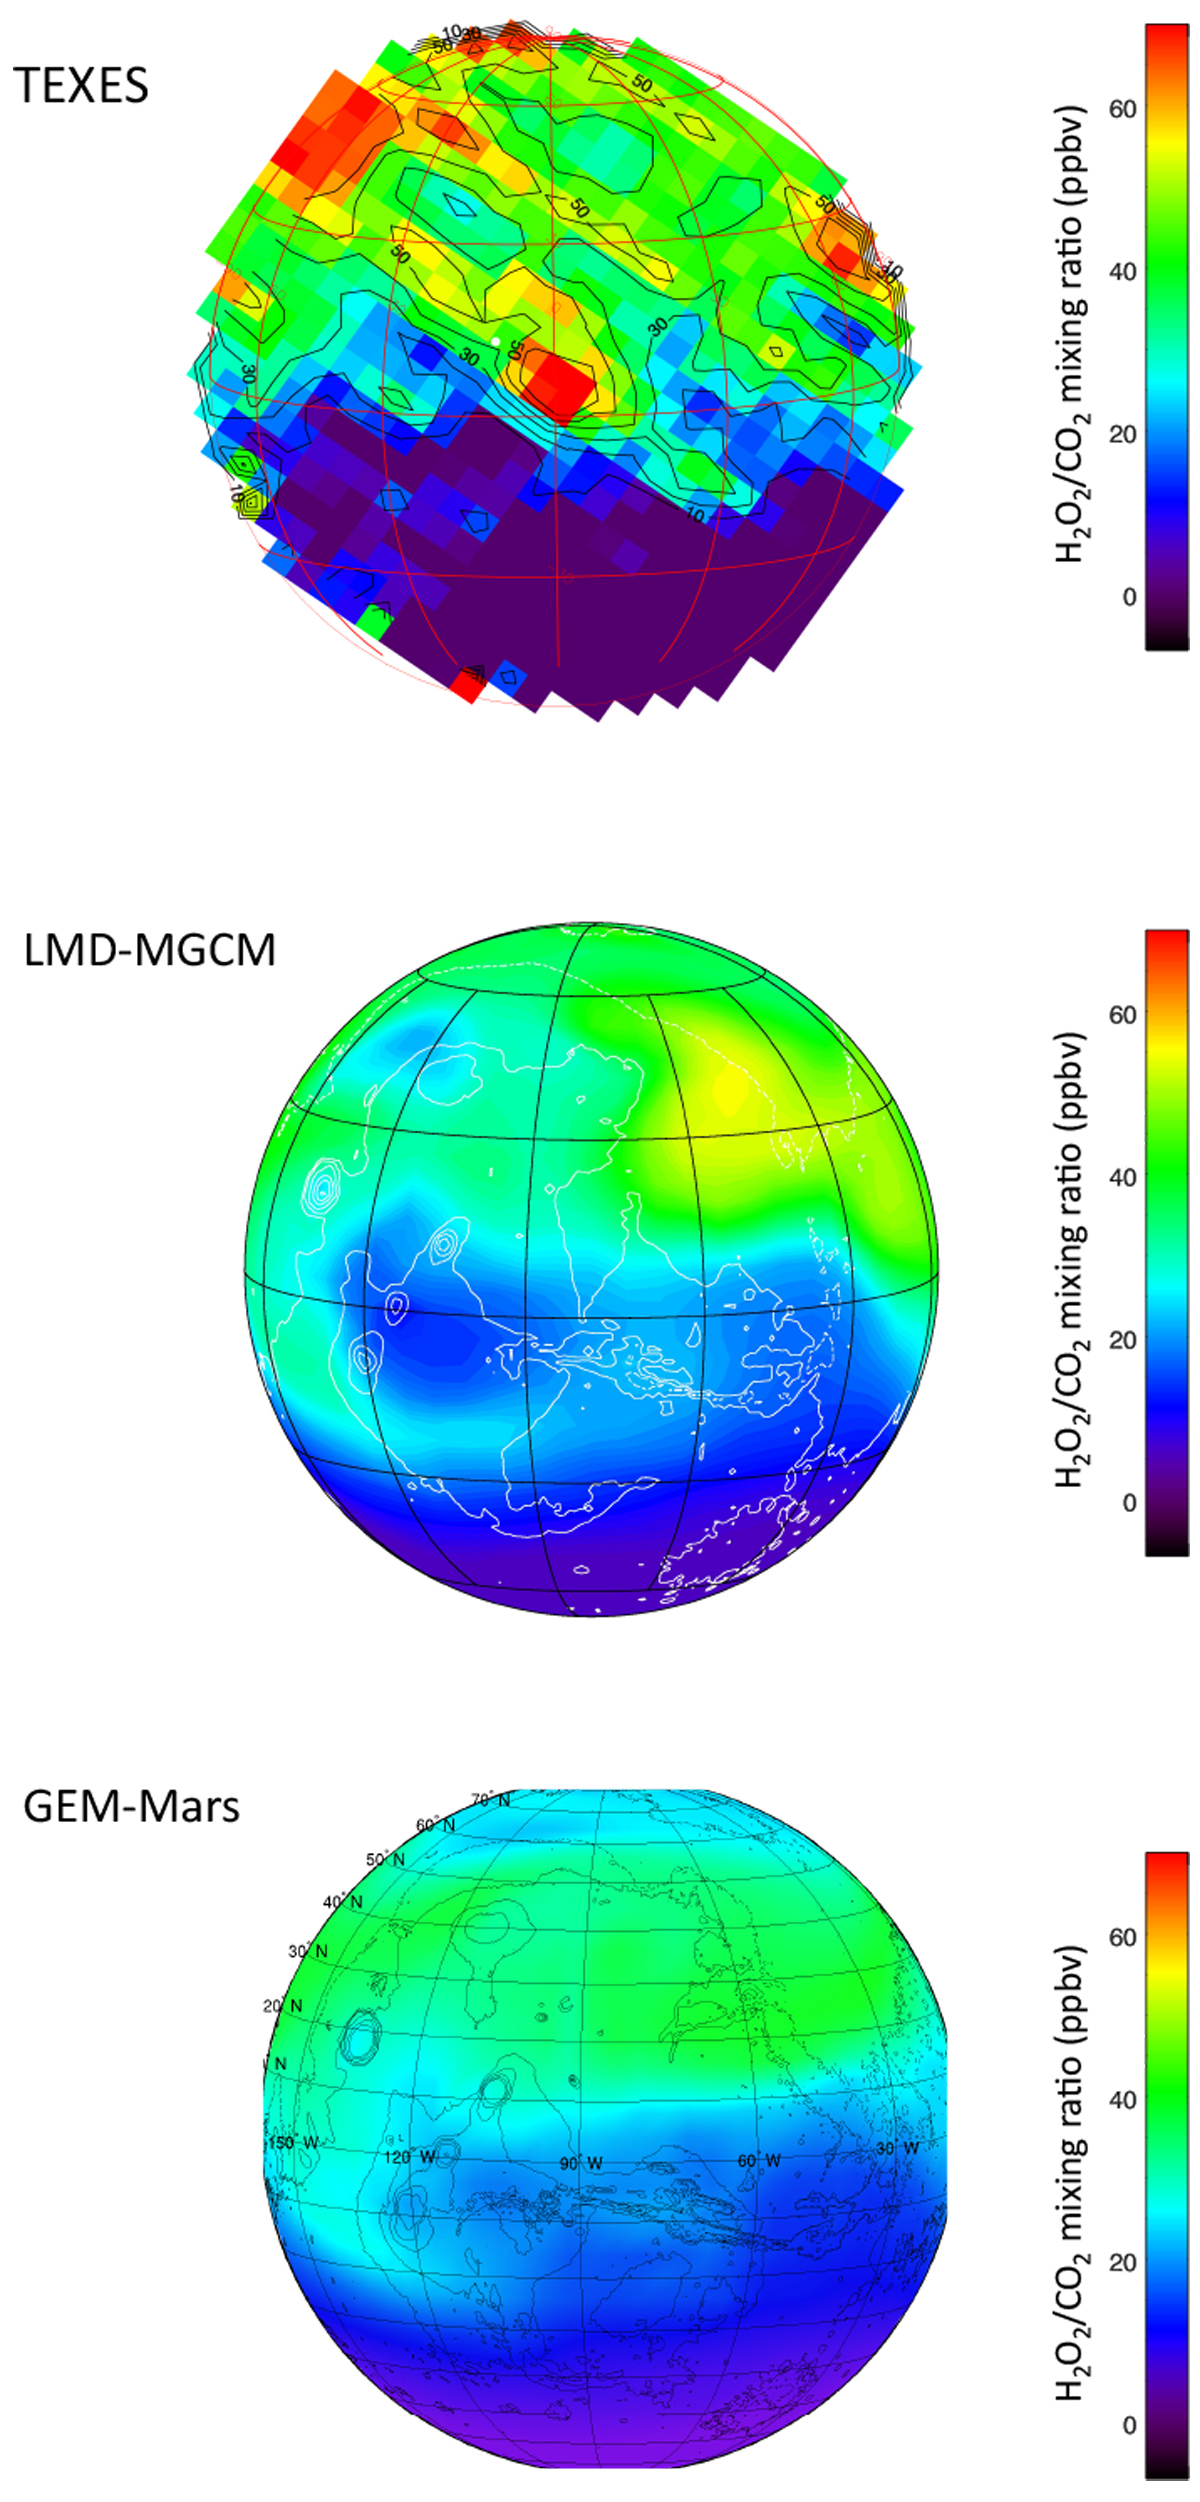
Top: map of the H2O2/CO2 volume mixing inferred from the H2O2/CO2 line depthratio, using the transitions shown in Fig. 2. The conversion factor between the H2O2 vmr and the H2O2 ldr is the following: vmr = 45.0/0.13 ldr (see text, Sect. 2.2). The subsolar point is shown as a white dot. Middle: synthetic map of the H2O2 vmr for Ls = 145–150° as predicted by the LMD-MGCM (Forget et al. 1999). Bottom: same synthetic map, generated by the GEM model (Daerden et al. 2019). The bright spots observed on the TEXES map at the limb may be an artifact, or due to the low signal near the limb, implying a larger error bar.
Current usage metrics show cumulative count of Article Views (full-text article views including HTML views, PDF and ePub downloads, according to the available data) and Abstracts Views on Vision4Press platform.
Data correspond to usage on the plateform after 2015. The current usage metrics is available 48-96 hours after online publication and is updated daily on week days.
Initial download of the metrics may take a while.