Fig. 18
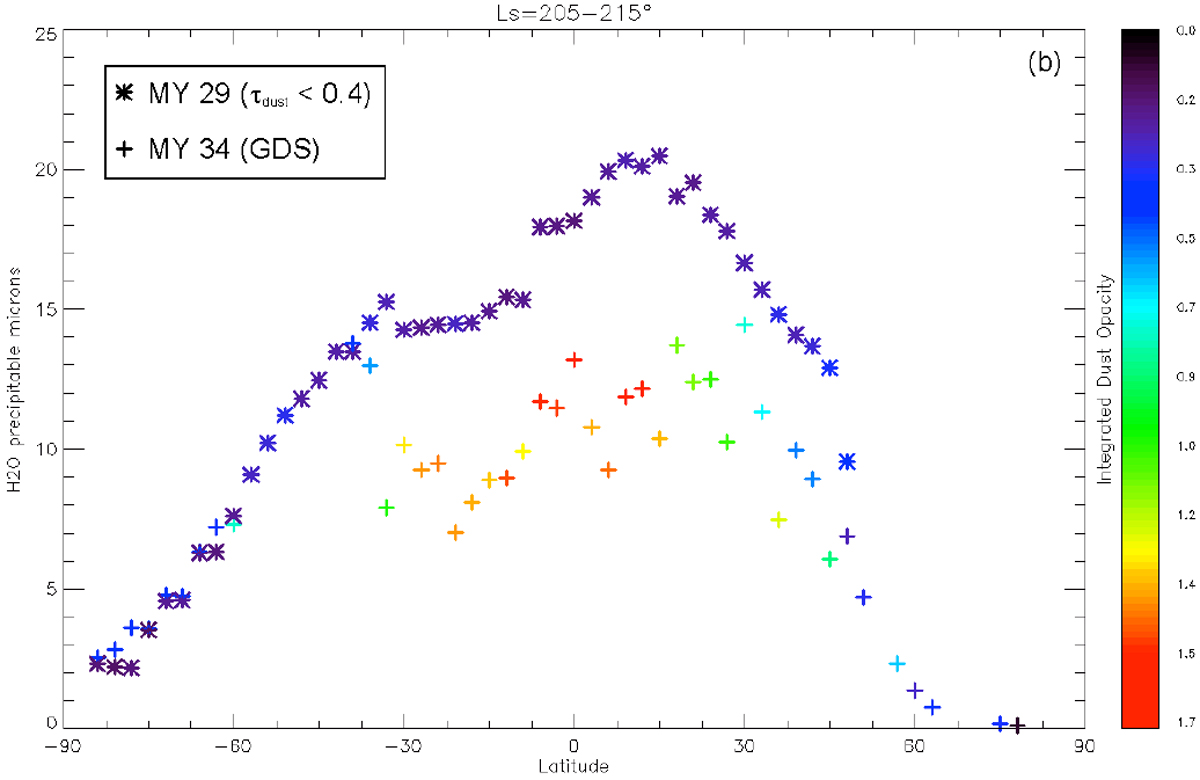
Latitudinal variations in the water vapor column density observed by PFS berween Ls = 205° and 215° in the case of MY 29, corresponding to a dust opacity lower than 0.4 (stars), and M34, a great dust storm (crosses). The color bar on the right of the figure indicates the integrated dust opacity. The figure is taken from Giuranna & Wolkenberg (2019).
Current usage metrics show cumulative count of Article Views (full-text article views including HTML views, PDF and ePub downloads, according to the available data) and Abstracts Views on Vision4Press platform.
Data correspond to usage on the plateform after 2015. The current usage metrics is available 48-96 hours after online publication and is updated daily on week days.
Initial download of the metrics may take a while.