Open Access
Fig. 17
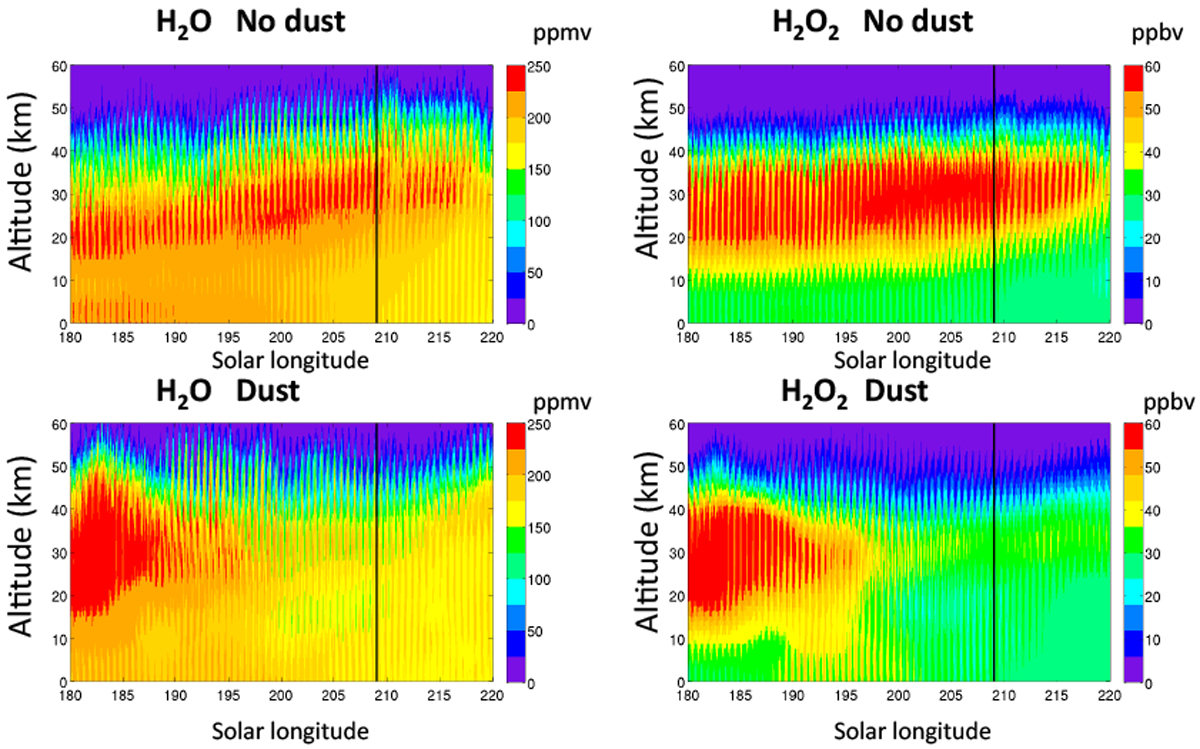
Vertical distributions of H2O (left) and H2O2 (right) as a function of the solar longitude at the beginning of southern summer (Ls = 180–220°) Top: clear conditions; bottom: dusty conditions. Simulations were done with the GEM model (Daerden et al. 2019) for the latitude of the subsolar point (12° S).
Current usage metrics show cumulative count of Article Views (full-text article views including HTML views, PDF and ePub downloads, according to the available data) and Abstracts Views on Vision4Press platform.
Data correspond to usage on the plateform after 2015. The current usage metrics is available 48-96 hours after online publication and is updated daily on week days.
Initial download of the metrics may take a while.