Fig. 16
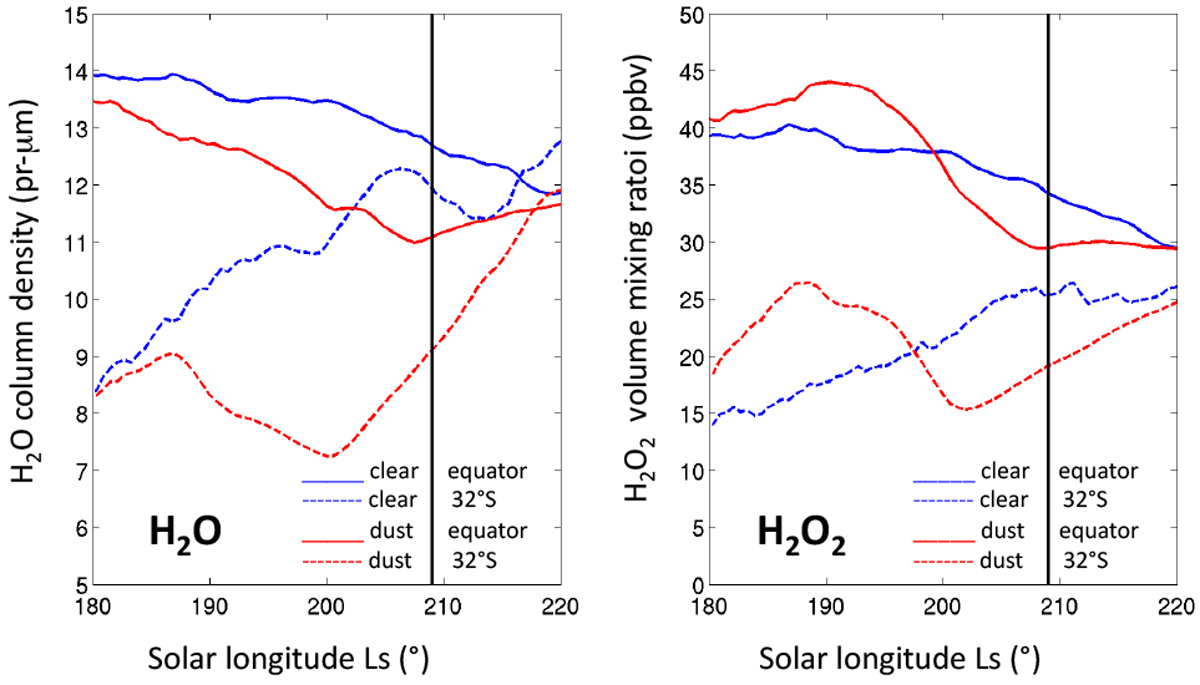
Seasonal variations in the H2O longitude-integrated column density (left) and the H2O2 longitude-integrated volume mixing ratio (right) during the beginning of southern summer (Ls = 180°–220°) in the case of a clear atmosphere (blue) and during a global dust storm (red). Solid curves: equator; dashed curves: 32S longitude. The black vertical line indicates the solar longitude corresponding to the TEXES observation.
Current usage metrics show cumulative count of Article Views (full-text article views including HTML views, PDF and ePub downloads, according to the available data) and Abstracts Views on Vision4Press platform.
Data correspond to usage on the plateform after 2015. The current usage metrics is available 48-96 hours after online publication and is updated daily on week days.
Initial download of the metrics may take a while.