Fig. 15
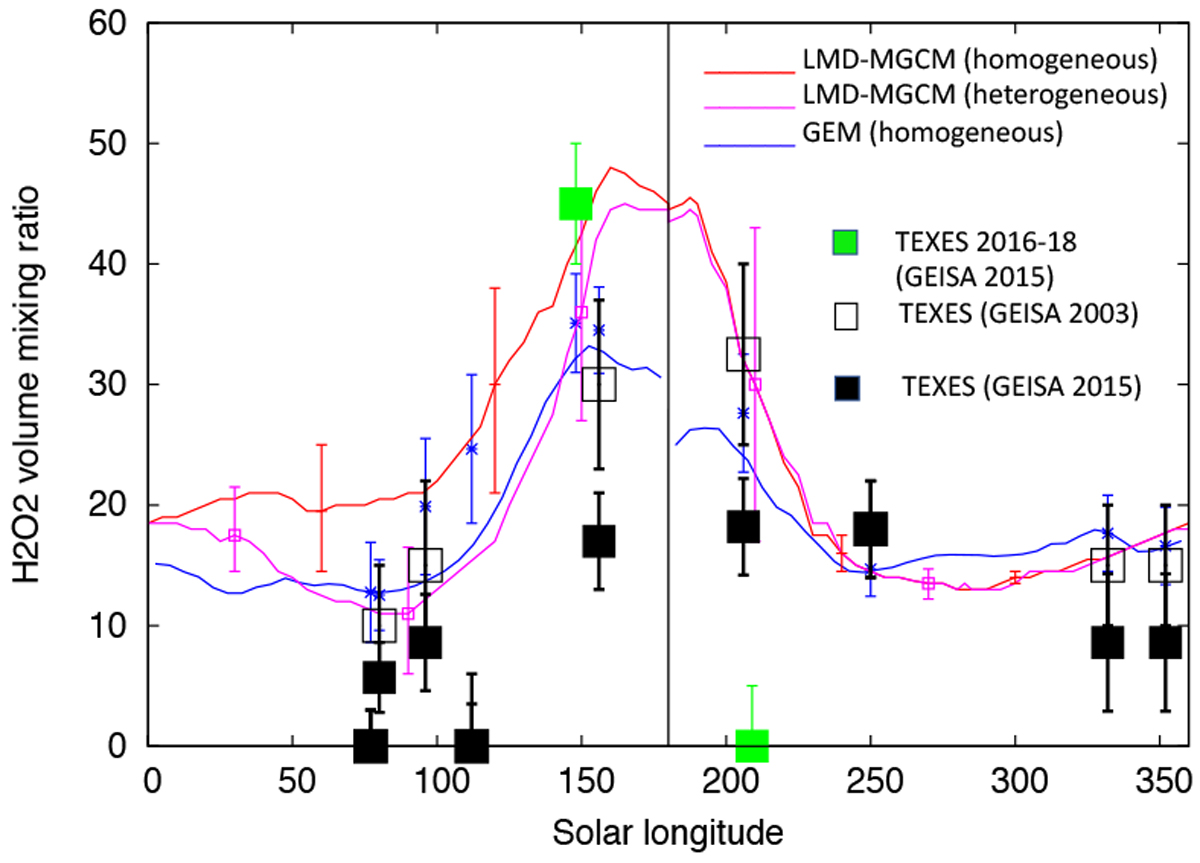
Seasonal cycle of H2O2 on Mars integrated over the Martian disk. The ordinate is the H2O2 volume mixing ratio in ppbv. Observed regions are centered over 20° N during northern spring and summer, and around 20° S during northern autumn and winter. Open squares: previous TEXES measurements of H2O2 (using GEISA 2003). Green squares: new TEXES observations (this paper). Black squares: recalibrated TEXES measurements of H2O2 (using GEISA 2015) and submillimeter measurements. Red curve: 3D global climate (LMD-MGCM) model including gas phase chemistry; purple curve: LMD-MGCM model considering heterogeneous chemistry on water ice grains (Lefèvre et al. 2008). The error bars correspond to the 1σ standard deviation of the H2O2 mean volume mixing ratio along the ±20° latitude parallel. Blue curve: 3D GEM model including gas phase chemistry (Daerden et al. 2019). All curves are calculated for a latitude of 20° N for Ls = 0–180° and 20° S for Ls = 180–360°, in order to account for the observing conditions. Blue crosses: H2O2 abundances inferred from the GEM model (Daerden et al. 2019) corresponding to the exact geometry of the observations. The black vertical bar indicates the autumn equinox. Error bars of the data points are ± σ.
Current usage metrics show cumulative count of Article Views (full-text article views including HTML views, PDF and ePub downloads, according to the available data) and Abstracts Views on Vision4Press platform.
Data correspond to usage on the plateform after 2015. The current usage metrics is available 48-96 hours after online publication and is updated daily on week days.
Initial download of the metrics may take a while.