Fig. 14
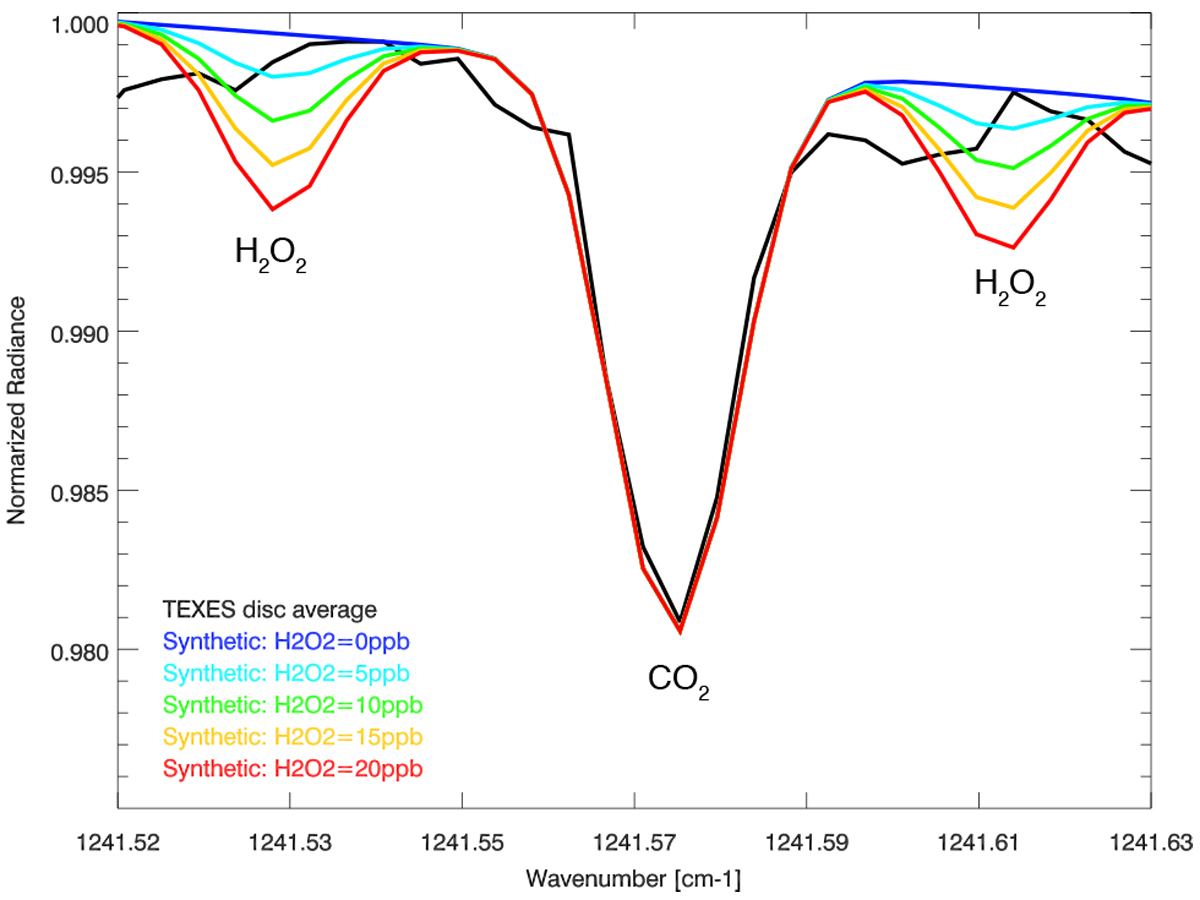
Black curve: normalized disk-integrated spectrum of Mars between 1241.52 and 1241.63 cm−1, recorded by TEXES on July 11, 2018 (as in Fig. 12). Colored lines indicate the synthetic spectra calculated with multiple scattering under the conditions of a global dust storm (see Sect. 3.3) for various values of the H2O2 vmr: 20 ppbv (red), 15 ppbv (orange), 10 ppbv (green), 5 ppbv (light blue), and 0 ppbv (blue). H2O2 is undetected in the TEXES spectrum, with a 2σ upper limit of 10 ppbv.
Current usage metrics show cumulative count of Article Views (full-text article views including HTML views, PDF and ePub downloads, according to the available data) and Abstracts Views on Vision4Press platform.
Data correspond to usage on the plateform after 2015. The current usage metrics is available 48-96 hours after online publication and is updated daily on week days.
Initial download of the metrics may take a while.