Fig. 6.
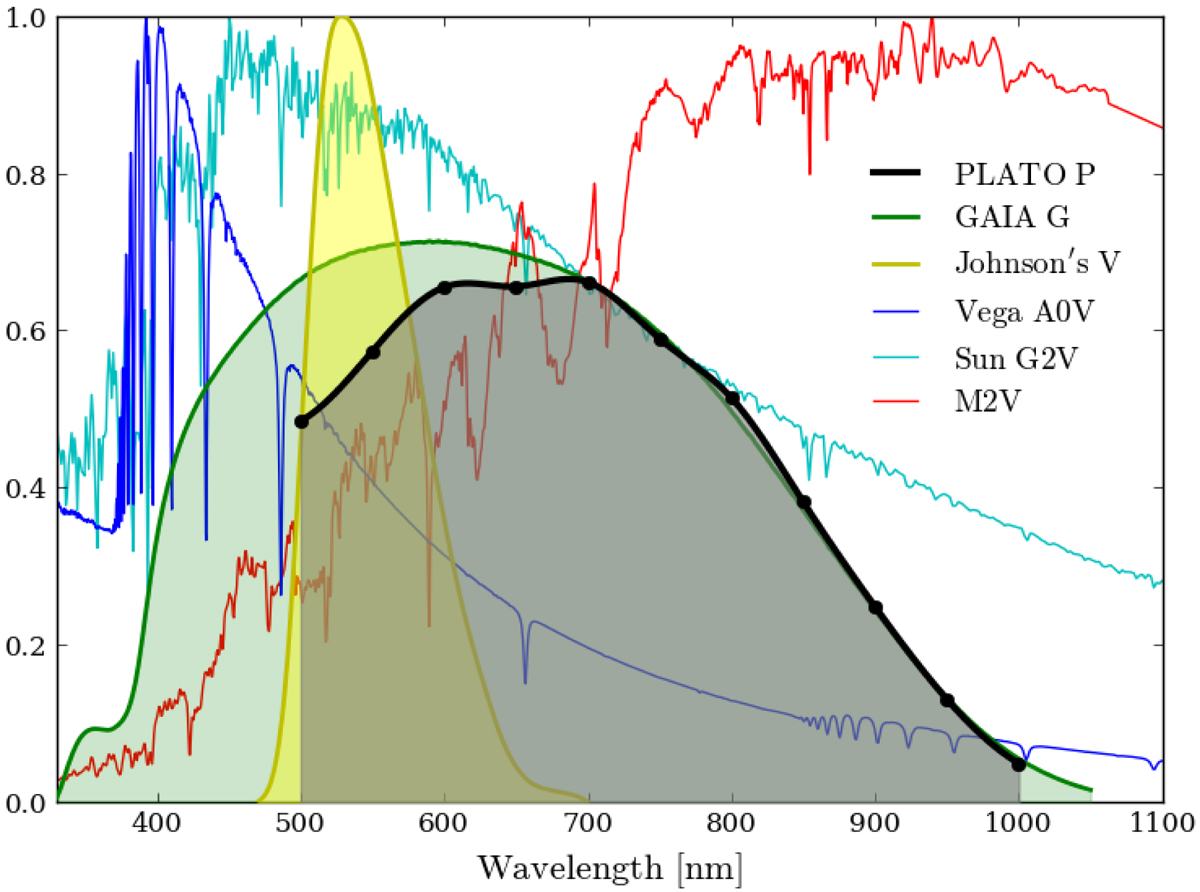
Black: preliminary spectral response of PLATO N-CAM at beginning of life. Values are currently known at the black dots; these are crossed by a cubic spline interpolation curve. Green: Gaia G band. Yellow: Johnson’s V filter. Blue: Vega (A0V) normalized spectrum. Cyan: Sun (G2V) normalized spectrum. Red: normalized spectrum of M2V-type star.
Current usage metrics show cumulative count of Article Views (full-text article views including HTML views, PDF and ePub downloads, according to the available data) and Abstracts Views on Vision4Press platform.
Data correspond to usage on the plateform after 2015. The current usage metrics is available 48-96 hours after online publication and is updated daily on week days.
Initial download of the metrics may take a while.