Fig. 5.
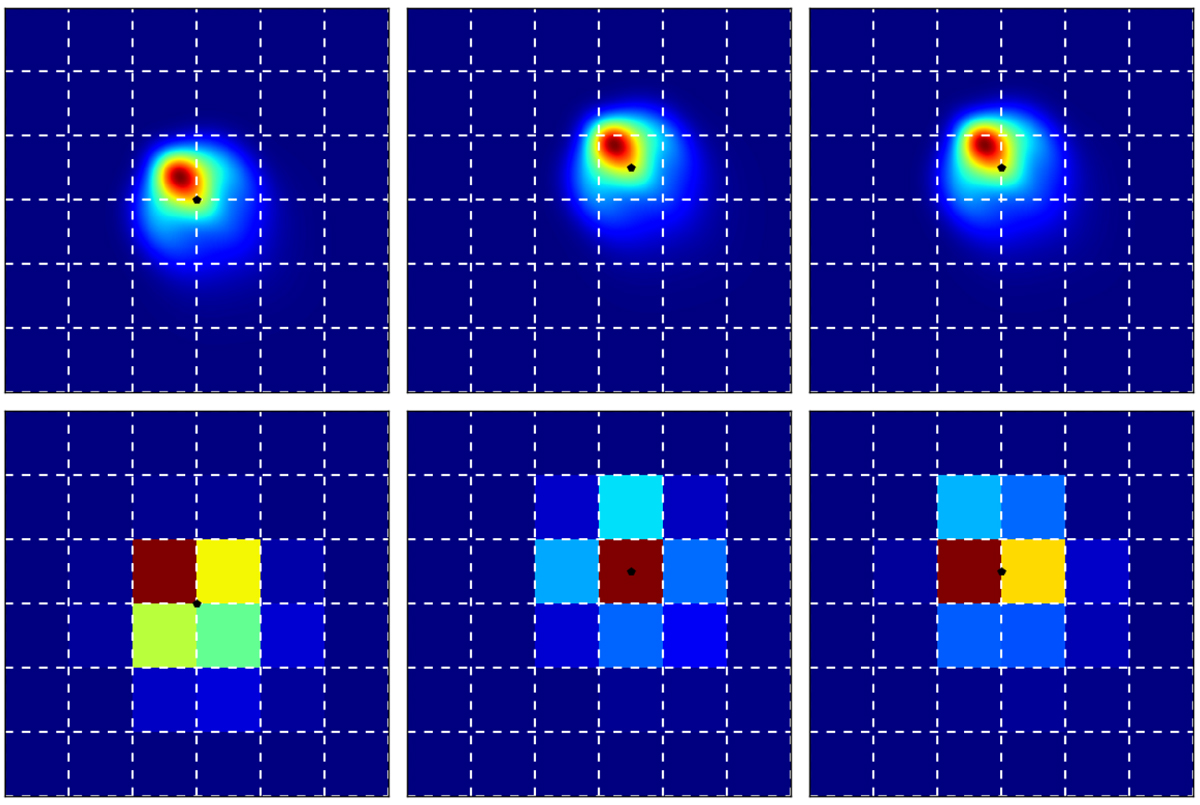
Energy distribution of PSF across the pixels for three distinct intra-pixel target barycentre locations (black dots): at pixel corner (left), at pixel centre (middle), and at the border of two adjacent pixels (right). Dashed white lines represent pixel borders. Top: high resolution PSF at α = 14°. Bottom: corresponding low resolution PSF.
Current usage metrics show cumulative count of Article Views (full-text article views including HTML views, PDF and ePub downloads, according to the available data) and Abstracts Views on Vision4Press platform.
Data correspond to usage on the plateform after 2015. The current usage metrics is available 48-96 hours after online publication and is updated daily on week days.
Initial download of the metrics may take a while.