Fig. 20.
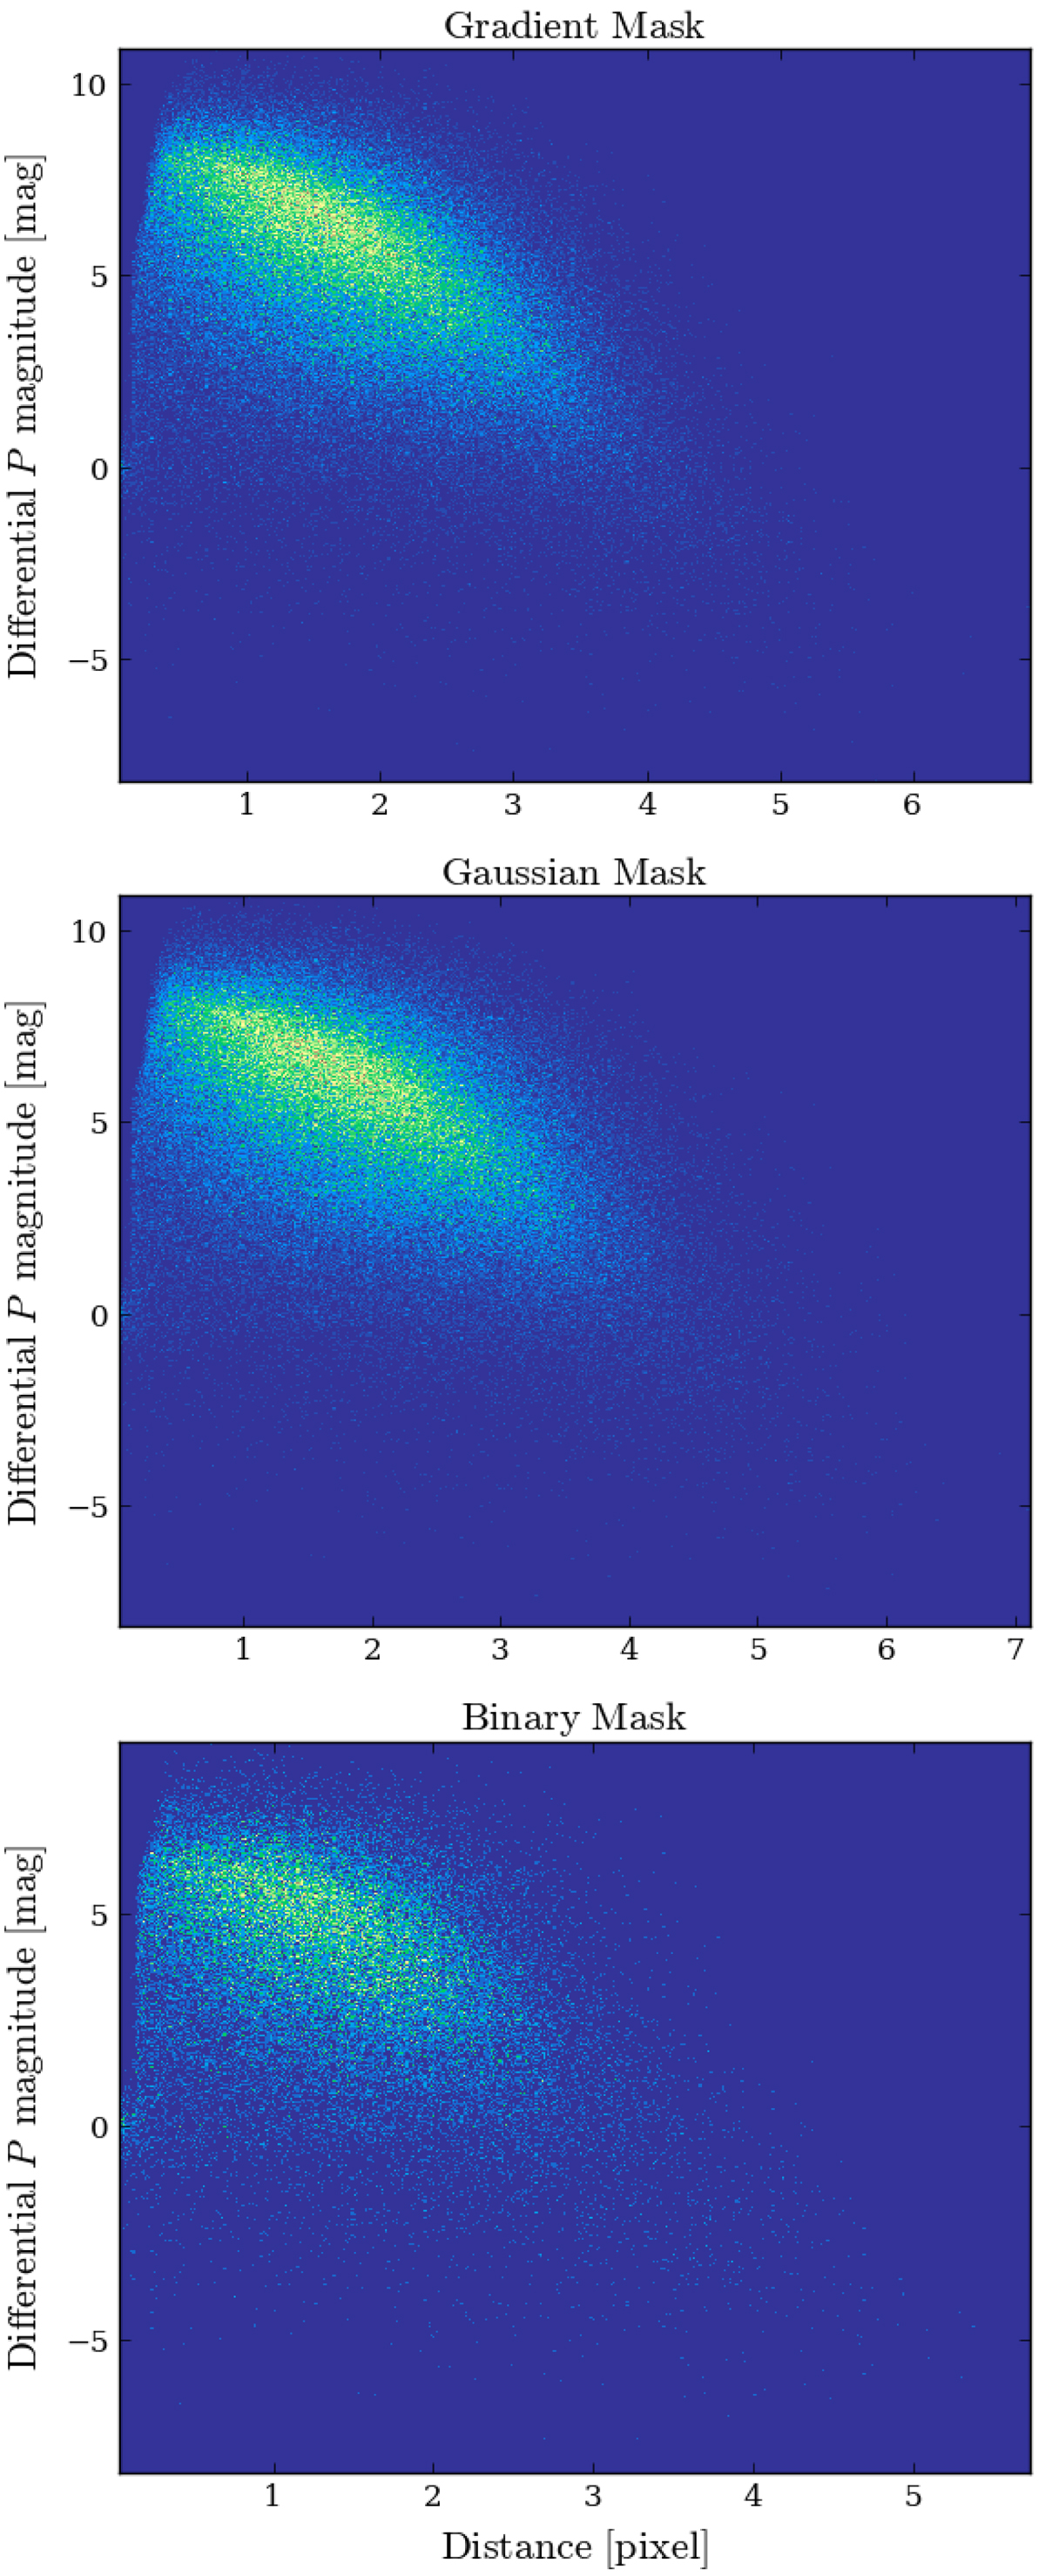
Two-dimensional histograms of the distribution of contaminant stars with ![]() , for gradient (top), Gaussian (centre), and binary (bottom) masks. The vertical axis indicates the differential P magnitude between the contaminants and their respective targets, whereas the horizontal axis indicates the corresponding Euclidean distances. The parameters used to calculate
, for gradient (top), Gaussian (centre), and binary (bottom) masks. The vertical axis indicates the differential P magnitude between the contaminants and their respective targets, whereas the horizontal axis indicates the corresponding Euclidean distances. The parameters used to calculate ![]() are δback, k = 0.8 mag, NT = 24, ntr = 3, and td = 4 h.
are δback, k = 0.8 mag, NT = 24, ntr = 3, and td = 4 h.
Current usage metrics show cumulative count of Article Views (full-text article views including HTML views, PDF and ePub downloads, according to the available data) and Abstracts Views on Vision4Press platform.
Data correspond to usage on the plateform after 2015. The current usage metrics is available 48-96 hours after online publication and is updated daily on week days.
Initial download of the metrics may take a while.