Fig. 19.
Scatter plot of ![]() normalized by
normalized by ![]() , computed for ∼3.25 million contaminant stars. This illustration represents the particular case where
, computed for ∼3.25 million contaminant stars. This illustration represents the particular case where ![]() is computed with δback, k ∼ 0.1 mag; NT = 12; ntr = 3; td = 4 h. Values of
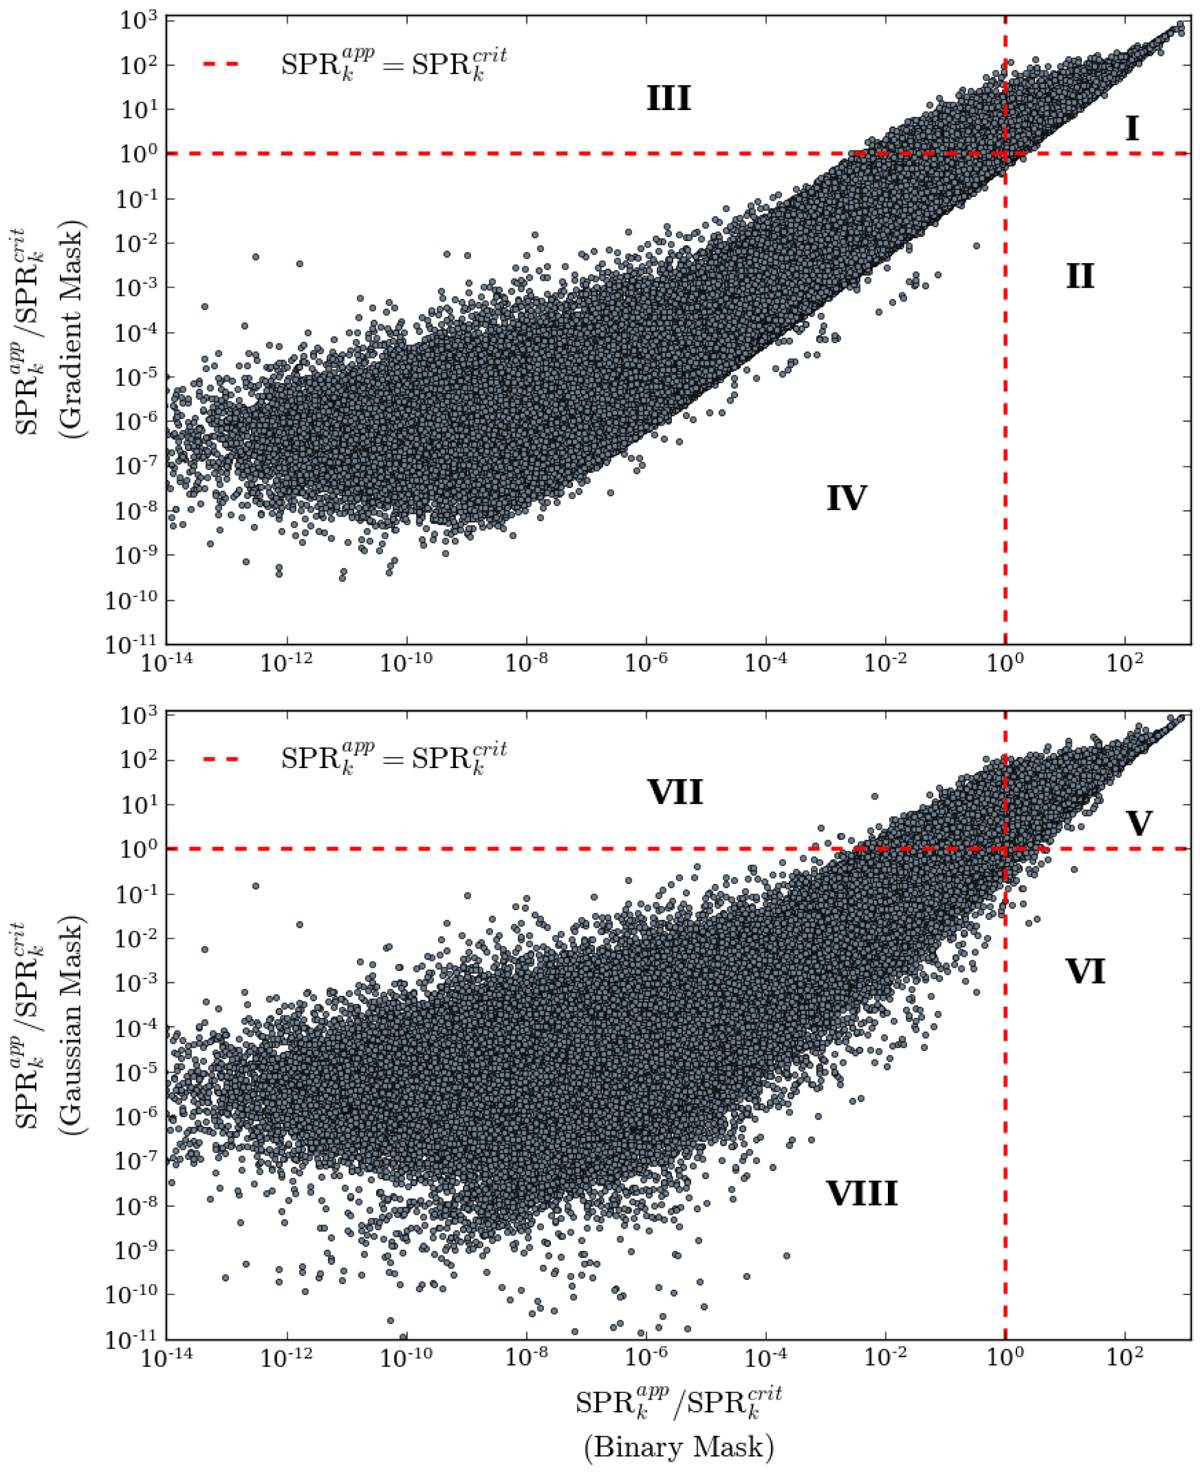
is computed with δback, k ∼ 0.1 mag; NT = 12; ntr = 3; td = 4 h. Values of ![]() are provided in Tables 11 and 12. Top: comparison between the values given by the gradient mask (vertical axis) and by the binary mask (horizontal axis). Region I: both masks exceed
are provided in Tables 11 and 12. Top: comparison between the values given by the gradient mask (vertical axis) and by the binary mask (horizontal axis). Region I: both masks exceed ![]() . Region II: only the binary mask exceeds
. Region II: only the binary mask exceeds ![]() . Region III: only the gradient mask exceeds
. Region III: only the gradient mask exceeds ![]() . Region IV: no mask exceeds
. Region IV: no mask exceeds ![]() . Bottom: comparison between the values given by the Gaussian mask (vertical axis) and the binary mask (horizontal axis). Regions V to VIII are analogous to I, II, III, and IV, respectively.
. Bottom: comparison between the values given by the Gaussian mask (vertical axis) and the binary mask (horizontal axis). Regions V to VIII are analogous to I, II, III, and IV, respectively.
Current usage metrics show cumulative count of Article Views (full-text article views including HTML views, PDF and ePub downloads, according to the available data) and Abstracts Views on Vision4Press platform.
Data correspond to usage on the plateform after 2015. The current usage metrics is available 48-96 hours after online publication and is updated daily on week days.
Initial download of the metrics may take a while.