Fig. 11.
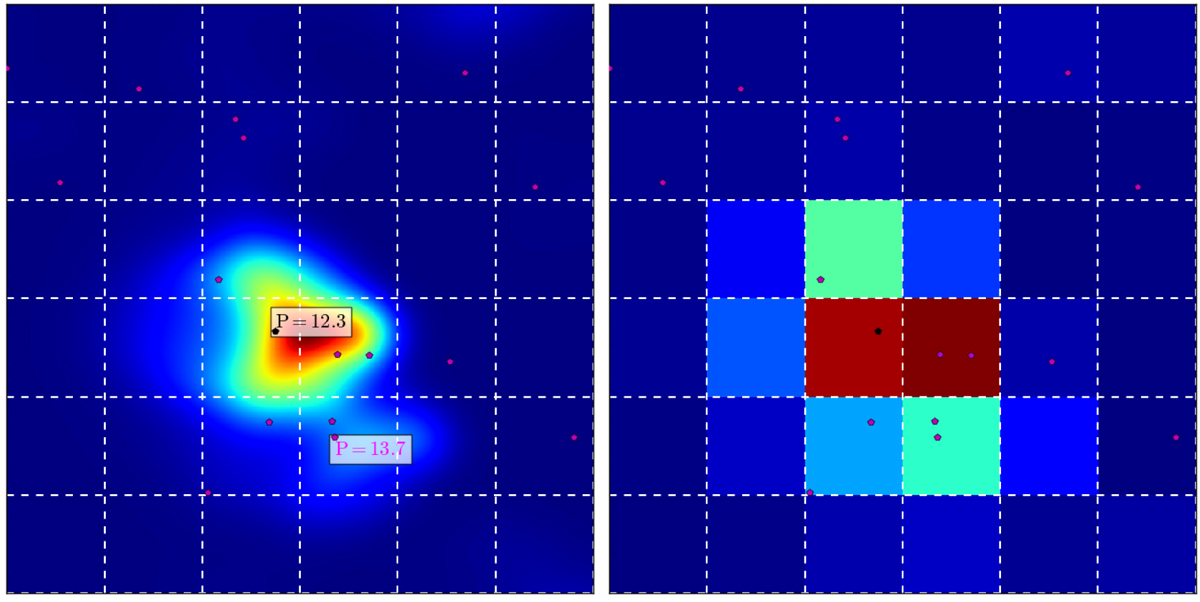
Example of input image. Left: high resolution PSF (α = 18°) for a target with P = 12.3 (barycentre designated by the black dot) surrounded by several contaminants (respective barycentres designated by the magenta dots). The brightest contaminant in the frame (tagged below the target) has P = 13.7. All other contaminants are at least 2 mag fainter than the target. Right: corresponding low resolution PSF (imagette) at pixel level. Zodiacal light is not shown in the scene. Dashed white lines represent pixel borders.
Current usage metrics show cumulative count of Article Views (full-text article views including HTML views, PDF and ePub downloads, according to the available data) and Abstracts Views on Vision4Press platform.
Data correspond to usage on the plateform after 2015. The current usage metrics is available 48-96 hours after online publication and is updated daily on week days.
Initial download of the metrics may take a while.