Fig. 10.
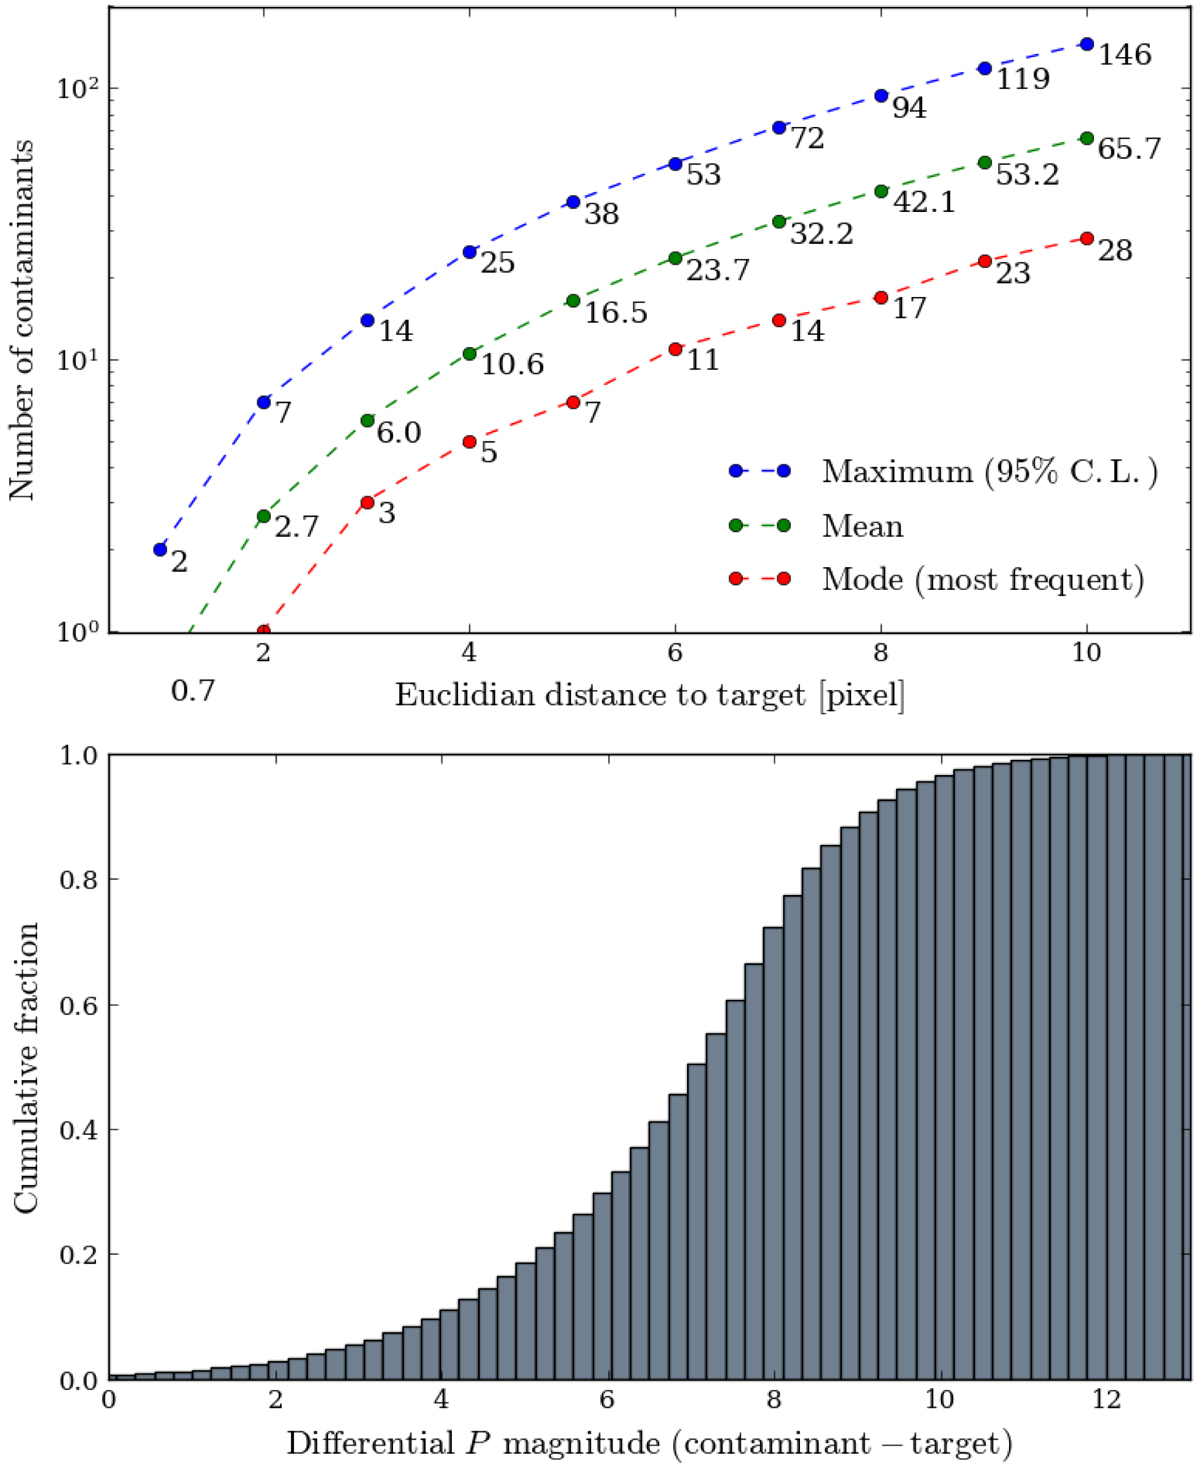
Top: number of contaminants brighter than P ∼ 21.1 as a function of the Euclidean distance from the target stars (7.66 ≤ P ≤ 12.66). Maximum values have 95% confidence level. Bottom: cumulative fraction of the differential P magnitude between contaminant and target stars, the former located at up to 10 pixels in distance from the latter.
Current usage metrics show cumulative count of Article Views (full-text article views including HTML views, PDF and ePub downloads, according to the available data) and Abstracts Views on Vision4Press platform.
Data correspond to usage on the plateform after 2015. The current usage metrics is available 48-96 hours after online publication and is updated daily on week days.
Initial download of the metrics may take a while.