Fig. 9.
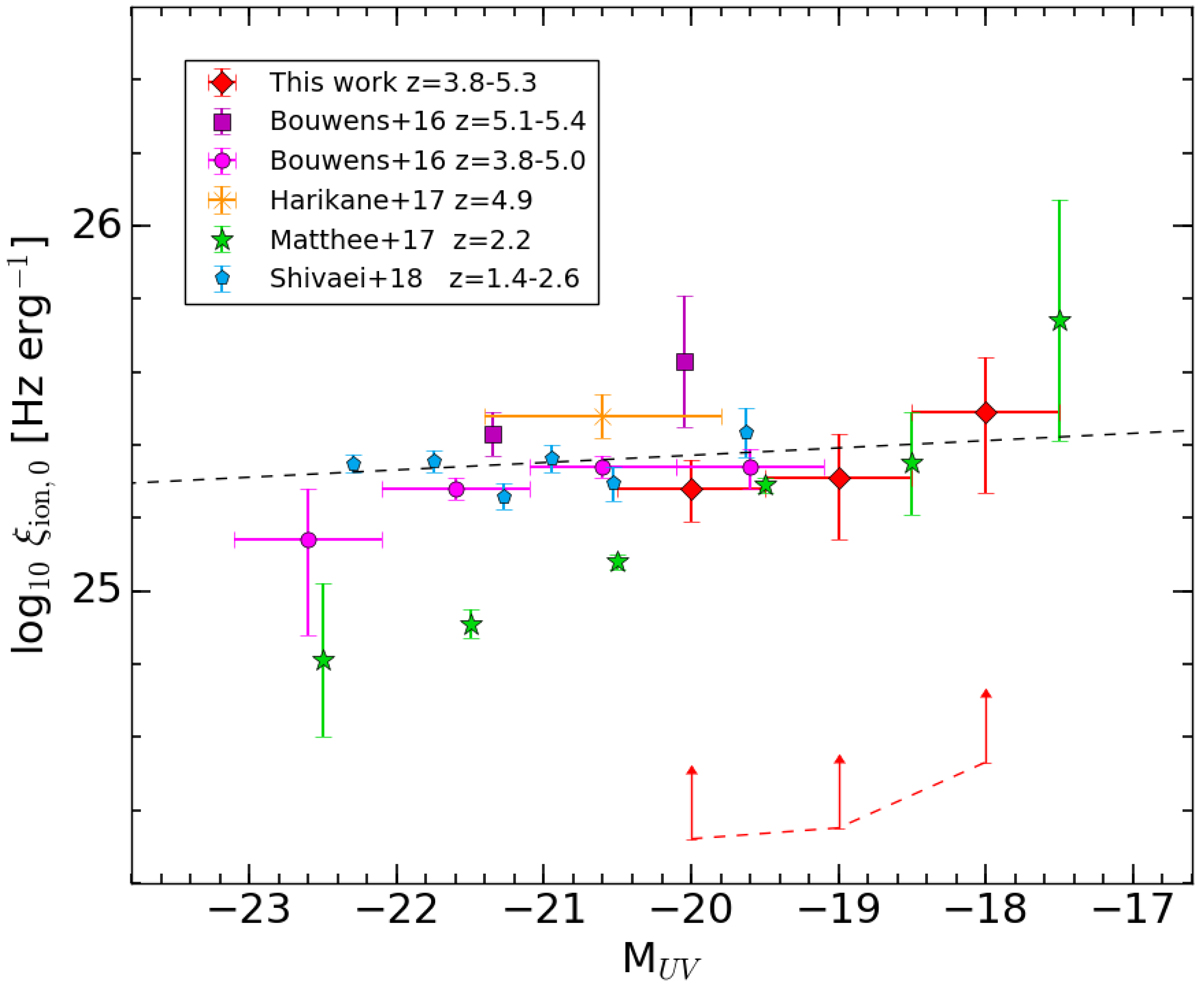
Present estimates of Lyman continuum photon production efficiency ξion, 0 vs. absolute UV luminosity MUV. The red dashed line denotes the lower limit for the population-averaged ξion, 0 obtained by making the extreme assumption that all sources in UV selections not appearing in our MUSE selections have ξion, 0 = 0 (see Sect. 4.4 for details). For comparison, also shown here are several previous estimates of ξion, 0 by Bouwens et al. (2016a) at z = 3.8–5.0 (light magenta) and z = 5.1–5.4 (dark magenta; using a revised binning, see Sect. 5.1.), Harikane et al. (2018) at z = 4.9 (orange), Matthee et al. (2017) at z = 2.2 (Meurer et al. 1999β-dust correction, green), and Shivaei et al. (2018) at z = 1.4−2.6 (SMC dust correction, blue). The black dashed line denotes the best-fit MUV dependence of ξion, 0 on MUV using the measurements of Bouwens et al. (2016a) and this work. The best-fit relation is ξion, 0 = 0.020(±0.031)(MUV + 20)+25.372(±0.045).
Current usage metrics show cumulative count of Article Views (full-text article views including HTML views, PDF and ePub downloads, according to the available data) and Abstracts Views on Vision4Press platform.
Data correspond to usage on the plateform after 2015. The current usage metrics is available 48-96 hours after online publication and is updated daily on week days.
Initial download of the metrics may take a while.