Fig. 8.
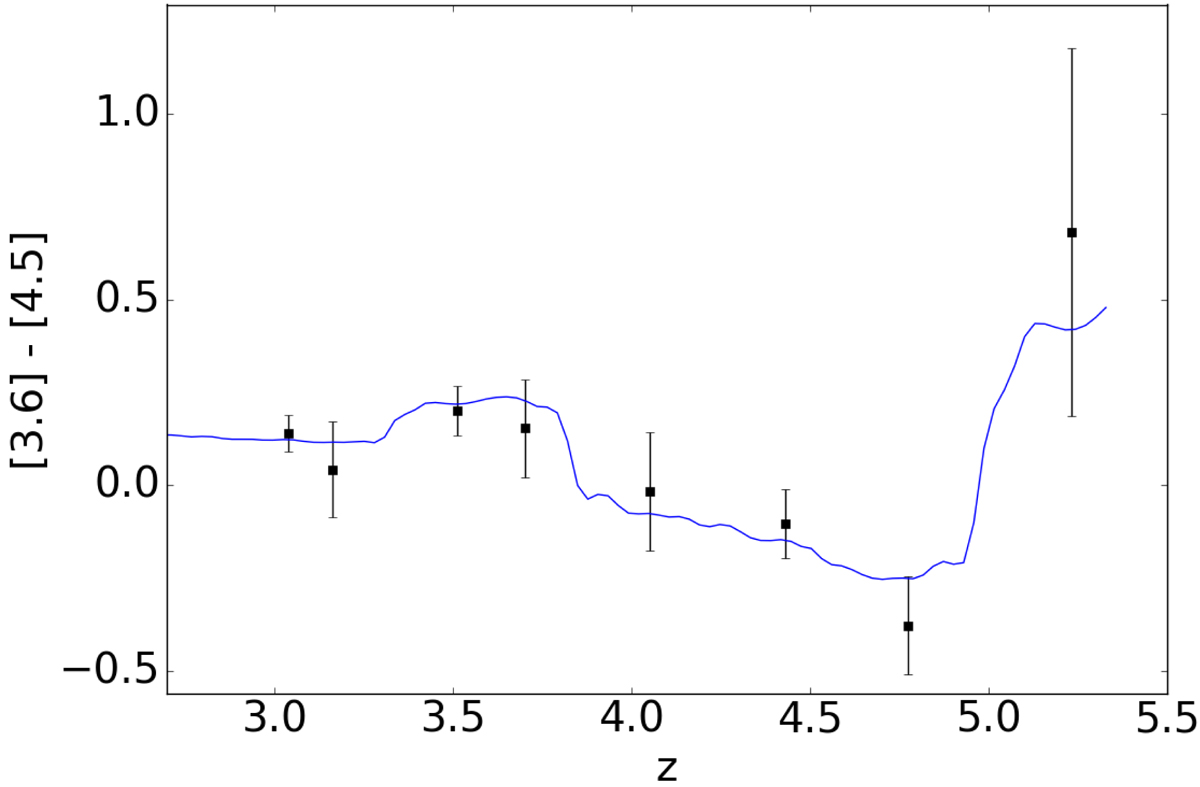
[3.6]−[4.5] color as a function of the redshift bin considered for our stacked Spitzer/IRAC images of sources with −20.5 < MUV < −19.5. The best-fit color model is shown in blue. The color model is the convolution of the 3.6 μm and 4.5 μm transmission curves with a simple model spectrum, which consists of a power-law continuum, an Hα line, an [S III] 9068.6 Å line, and five secondary lines whose strengths are fixed relative to that of the Hα line (Sect. 4.2).
Current usage metrics show cumulative count of Article Views (full-text article views including HTML views, PDF and ePub downloads, according to the available data) and Abstracts Views on Vision4Press platform.
Data correspond to usage on the plateform after 2015. The current usage metrics is available 48-96 hours after online publication and is updated daily on week days.
Initial download of the metrics may take a while.