Fig. 5.
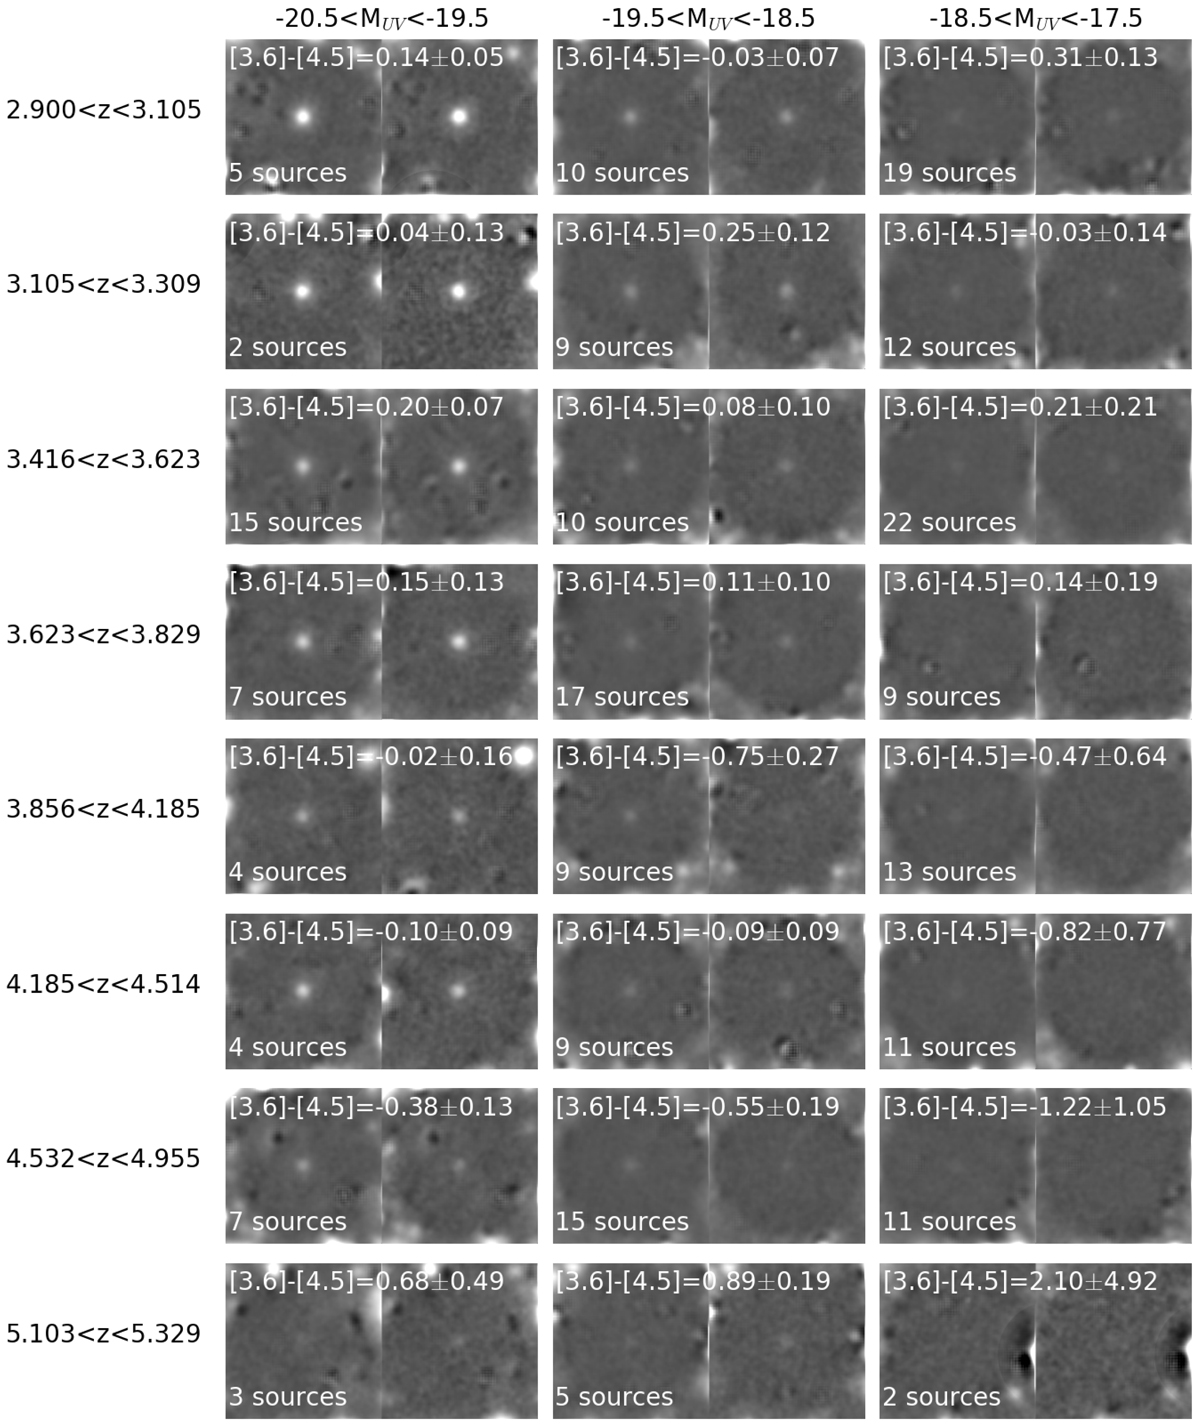
Stacked Spitzer/IRAC [3.6] (left) and [4.5] (right) images of sources found in the redshift intervals 2.900 < z < 3.105, 3.105 < z < 3.309, 3.416 < z < 3.623, 3.623 < z < 3.829, 3.856 < z < 4.185, 4.185 < z < 4.514, 4.532 < z < 4.955, and 5.105 < z < 5.329. Only sources with satisfactory neighbor subtractions and spectroscopic redshifts consistent with their photometric redshifts are included in the stacks. The stacks are binned into three groups of intrinsic luminosity, −20.5 < MUV < −19.5, −19.5 < MUV < −18.5, and −18.5 < MUV < −17.5. Some neighboring objects remain in the corners because the subtraction is performed within a diameter of 12″ instead of a square of the same size.
Current usage metrics show cumulative count of Article Views (full-text article views including HTML views, PDF and ePub downloads, according to the available data) and Abstracts Views on Vision4Press platform.
Data correspond to usage on the plateform after 2015. The current usage metrics is available 48-96 hours after online publication and is updated daily on week days.
Initial download of the metrics may take a while.