Fig. 4.
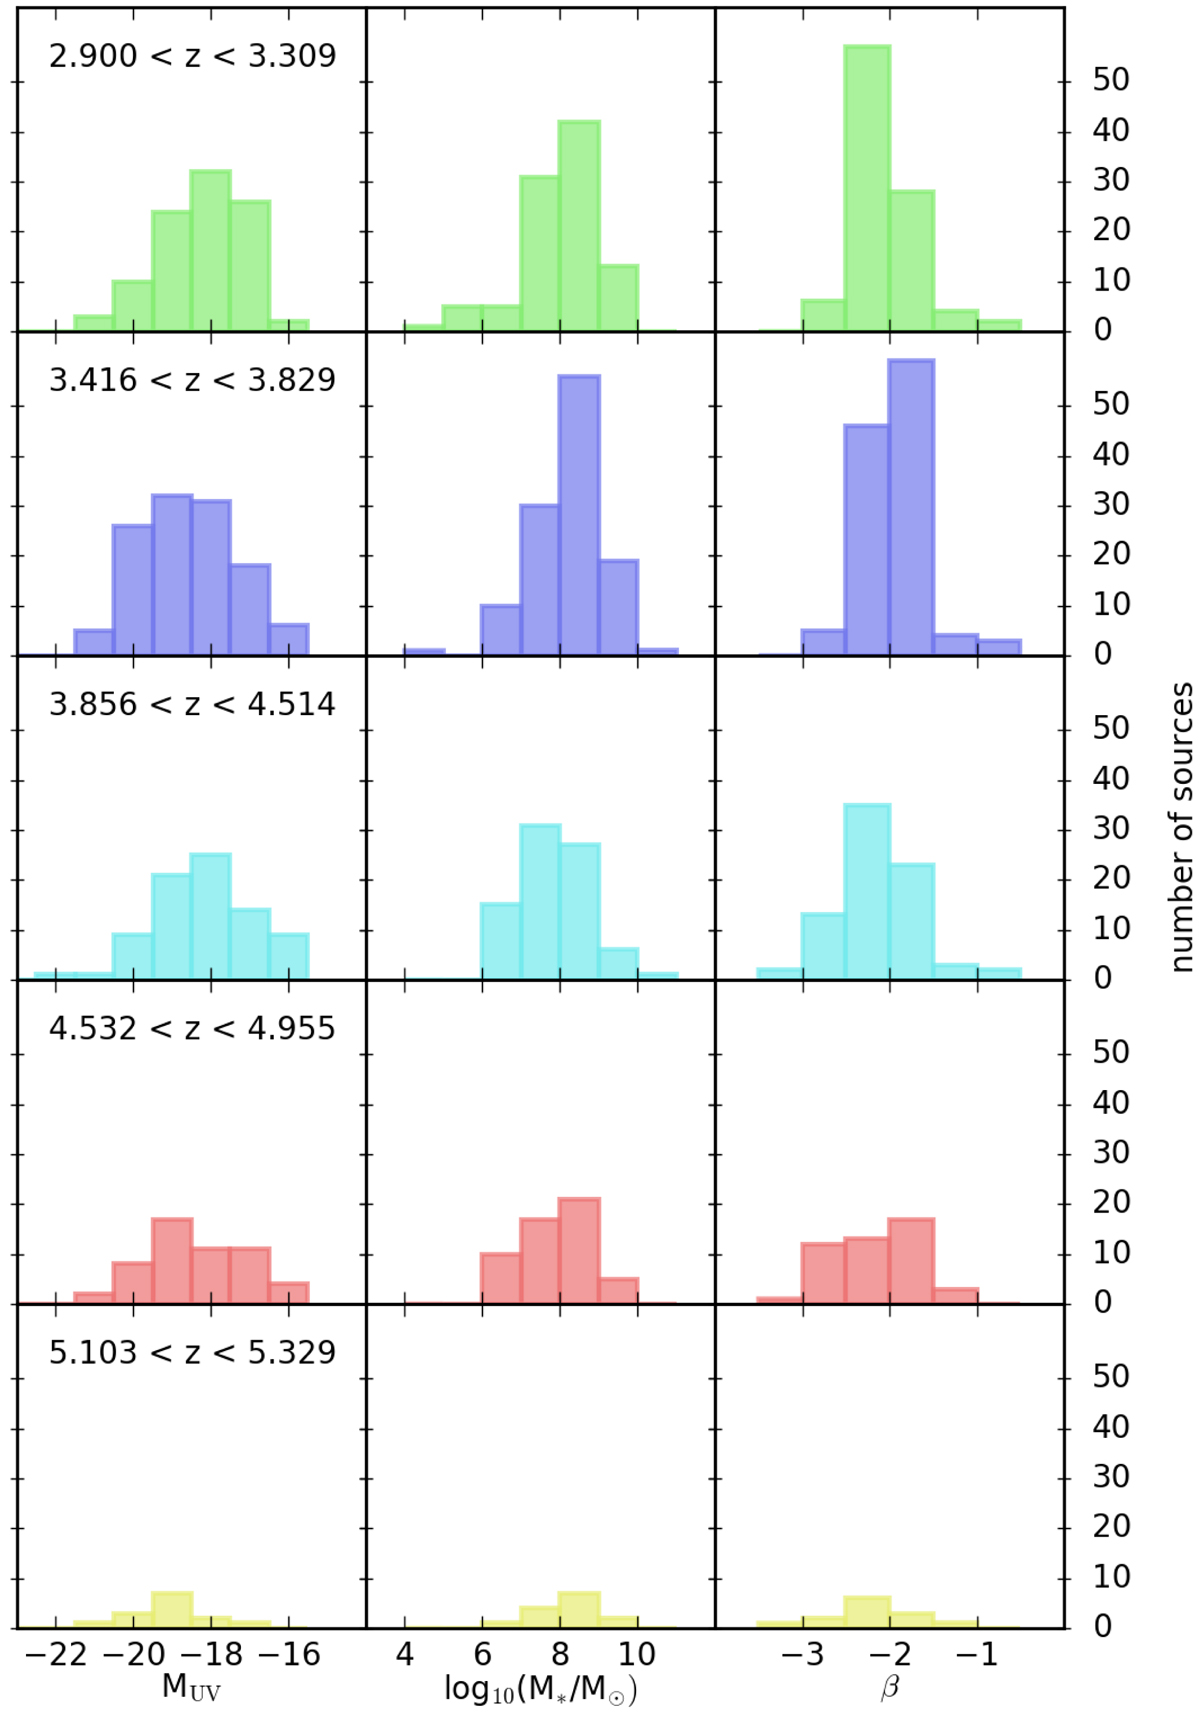
Number of sources in each of the spectroscopic redshift intervals as a function of their absolute magnitudes (left column), stellar masses (middle column), and UV continuum slopes (right column). In estimating the strength of the Hα and [S III] lines, we make use of stacks of the Spitzer/IRAC images of the sources from each bin.
Current usage metrics show cumulative count of Article Views (full-text article views including HTML views, PDF and ePub downloads, according to the available data) and Abstracts Views on Vision4Press platform.
Data correspond to usage on the plateform after 2015. The current usage metrics is available 48-96 hours after online publication and is updated daily on week days.
Initial download of the metrics may take a while.