Fig. 3.
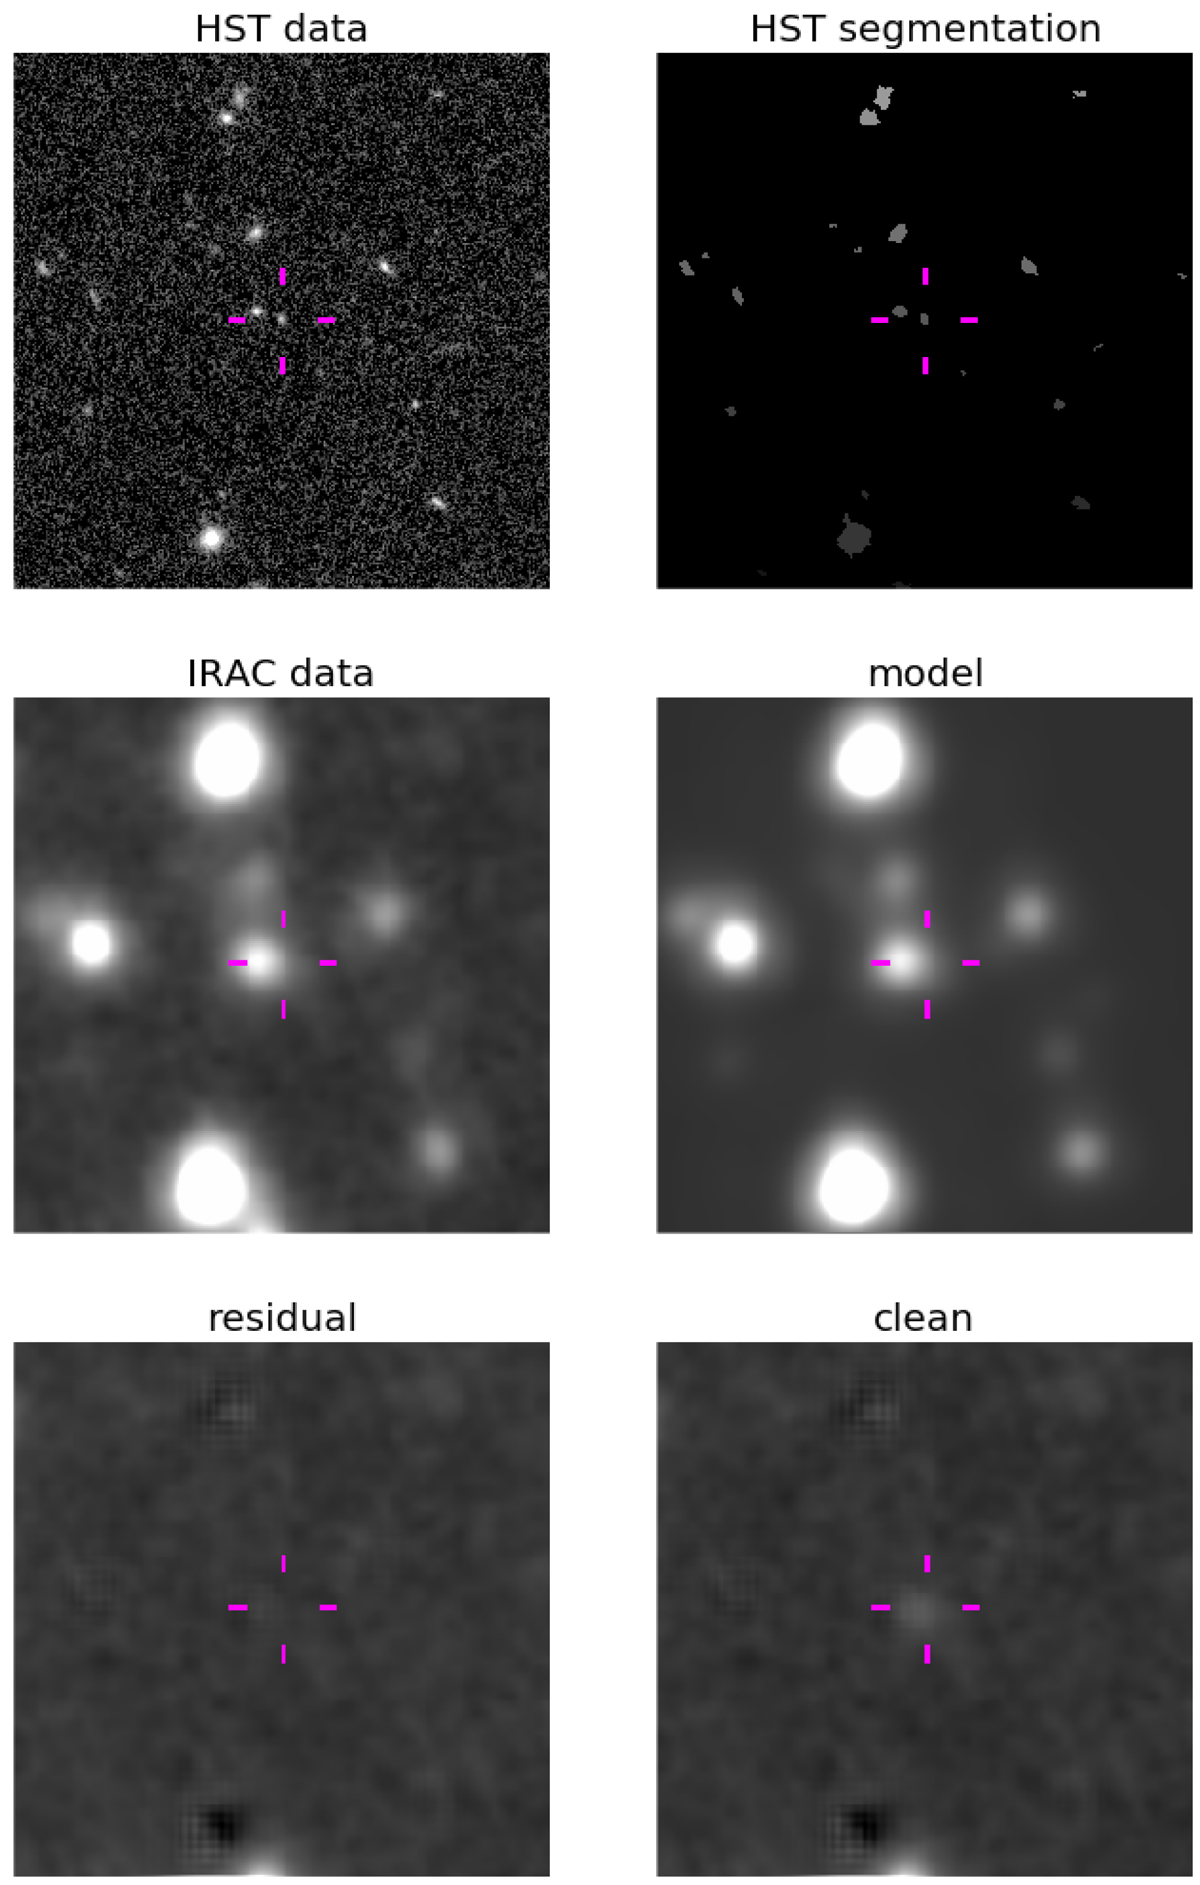
Illustration of how the subtraction of flux from neighboring sources is performed on the Spitzer/IRAC images to derive accurate photometry for one of our sources in our sample. The “HST data” panel (upper left) shows a cut-out of the original F850LP image centered on a galaxy at z = 4.54. The “HST segmentation” panel (upper right) shows the SExtractor segmentation map over the same region. The “IRAC data” panel (middle left) shows the original Spitzer/IRAC 3.6 μm image. The “model” panel (middle right) shows the best-fit model constructed from segments of psf-matched HST F850LP data. The “residual” panel (lower left) is the residual subtracting the full model from the data. In the “clean” panel (lower right), all objects are subtracted except the target itself. The Spitzer/IRAC 3.6 μm flux is then measured from the “clean” image. Each tile size is 18″ × 18″.
Current usage metrics show cumulative count of Article Views (full-text article views including HTML views, PDF and ePub downloads, according to the available data) and Abstracts Views on Vision4Press platform.
Data correspond to usage on the plateform after 2015. The current usage metrics is available 48-96 hours after online publication and is updated daily on week days.
Initial download of the metrics may take a while.